本教程演示如何使用 Jupyter 笔记本与 Power BI 交互,并检测表与 SemPy 库之间的关系。
本教程介绍如何:
- 使用语义链接的 Python 库(SemPy)发现语义模型中的关系(Power BI 数据集)。
- 使用与 Power BI 集成的 SemPy 组件并自动执行数据质量分析。 这些组件包括:
-
FabricDataFrame- 使用语义信息增强的类似 pandas 的结构 - 将语义模型从 Fabric 工作区拉取到笔记本中的函数
- 测试函数依赖项并识别语义模型中的关系冲突的函数
-
先决条件
获取 Microsoft Fabric 订阅。 或者,注册免费的 Microsoft Fabric 试用版。
登录 Microsoft Fabric。
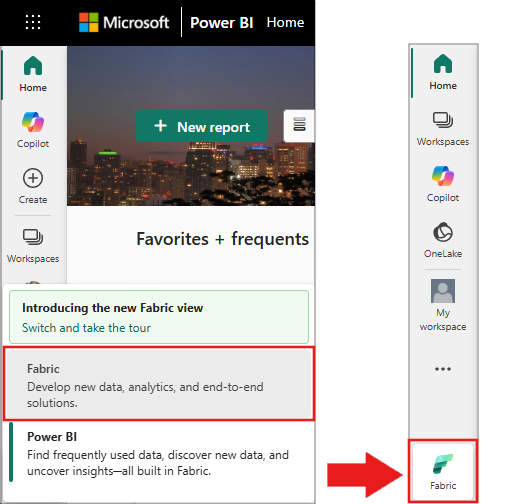
使用主页左下侧的体验切换器切换到 Fabric。
转到导航窗格中的 工作区 ,然后选择工作区将其设置为当前工作区。
从构造示例 GitHub 存储库下载客户盈利示例.pbix 和客户盈利率示例(auto.pbix 语义模型),然后将其上传到工作区。
在笔记本中继续操作
使用 powerbi_relationships_tutorial.ipynb 笔记本继续作。
若要打开本教程随附的笔记本,请按照 为数据科学教程准备系统 中的说明将笔记本导入工作区。
如果要复制并粘贴此页面中的代码,可以 创建新的笔记本。
在开始运行代码之前,请务必将湖屋附加到笔记本。
设置笔记本
使用所需的模块和数据设置笔记本环境。
semantic-link使用%pip笔记本中的内联命令从 PyPI 安装包。%pip install semantic-linksempy导入稍后将使用的模块。import sempy.fabric as fabric from sempy.relationships import plot_relationship_metadata from sempy.relationships import find_relationships from sempy.fabric import list_relationship_violationspandas导入库并设置输出格式的显示选项。import pandas as pd pd.set_option('display.max_colwidth', None)
## Explore semantic models

This tutorial uses the Customer Profitability Sample semantic model [_Customer Profitability Sample.pbix_](https://github.com/microsoft/fabric-samples/blob/main/docs-samples/data-science/datasets/Customer%20Profitability%20Sample.pbix). Learn about the semantic model in [Customer Profitability sample for Power BI](/power-bi/create-reports/sample-customer-profitability).

- Use SemPy's `list_datasets` function to explore semantic models in your current workspace:

  ```python
  fabric.list_datasets()
对于此笔记本的其余部分,请使用两个版本的客户盈利率示例语义模型:
- 客户盈利率示例:Power BI 示例中提供的语义模型,具有预定义的表关系
- 客户盈利率示例(自动):相同的数据,但关系仅限于 Power BI 自动检测
从示例语义模型中提取预定义关系
使用 SemPy 的函数加载客户盈利率示例语义模型中的
list_relationships预定义关系。 该函数列出表格对象模型(TOM)中的关系。dataset = "Customer Profitability Sample" relationships = fabric.list_relationships(dataset) relationshipsrelationships使用 SemPy 的plot_relationship_metadata函数将 DataFrame 可视化为图形。plot_relationship_metadata(relationships)
此图显示此语义模型中表之间的关系,如主题专家在 Power BI 中定义。

发现其他关系
如果从 Power BI 自动检测的关系开始,则设置较小。
可视化 Power BI 在语义模型中自动检测到的关系:
dataset = "Customer Profitability Sample (auto)"
autodetected = fabric.list_relationships(dataset)
plot_relationship_metadata(autodetected)
Power BI 的自动检测错过了许多关系。 此外,两个自动检测的关系在语义上不正确:
-
Executive[ID]->Industry[ID] -
BU[Executive_id]->Industry[ID]
-
将关系打印为表:
autodetected行 3 和 4 显示与
Industry表的关系不正确。 删除这些行。删除错误识别的关系。
# Remove rows 3 and 4 which point incorrectly to Industry[ID]
autodetected = autodetected[~autodetected.index.isin([3, 4])]
现在,你有正确但不完整的关系。 使用以下
plot_relationship_metadata方法可视化这些不完整的关系:plot_relationship_metadata(autodetected)
使用 SemPy 和
函数从语义模型加载所有表,然后使用 < a0 /> 查找表之间的关系。 查看日志输出,深入了解此函数的工作原理: suggested_relationships_all = find_relationships( tables, name_similarity_threshold=0.7, coverage_threshold=0.7, verbose=2 )可视化新发现的关系:
plot_relationship_metadata(suggested_relationships_all)
SemPy 检测所有关系。
使用
exclude参数将搜索限制为以前未标识的其他关系:additional_relationships = find_relationships( tables, exclude=autodetected, name_similarity_threshold=0.7, coverage_threshold=0.7 ) additional_relationships


验证关系
首先,从 客户盈利率示例 语义模型加载数据。
dataset = "Customer Profitability Sample"
tables = {table: fabric.read_table(dataset, table) for table in fabric.list_tables(dataset)['Name']}

tables.keys()
检查主键和外键与函数重叠
list_relationship_violations。 将函数的list_relationships输出传递给list_relationship_violations.list_relationship_violations(tables, fabric.list_relationships(dataset))结果显示有用的见解。 例如,其中七个值中的
Fact[Product Key]一个不存在Product[Product Key],缺少的键是50。探索性数据分析和数据清理是迭代的。 你学到的内容取决于你的问题以及如何浏览数据。 语义链接会添加有助于对数据执行更多作的工具。
相关内容
浏览有关语义链接和 SemPy 的其他教程:
\n\n