Note
Access to this page requires authorization. You can try signing in or changing directories.
Access to this page requires authorization. You can try changing directories.
This article describes how to pull diagnostic logs and metrics data from your Azure resources and stream into Microsoft Fabric.
Prerequisites
- Access to a workspace in the Fabric capacity license mode (or) the Trial license mode with Contributor or higher permissions.
Data sources page
Sign in to Microsoft Fabric.
If you see Power BI at the bottom-left of the page, switch to the Fabric workload by selecting Power BI and then by selecting Fabric.
Select Real-Time on the left navigation bar.
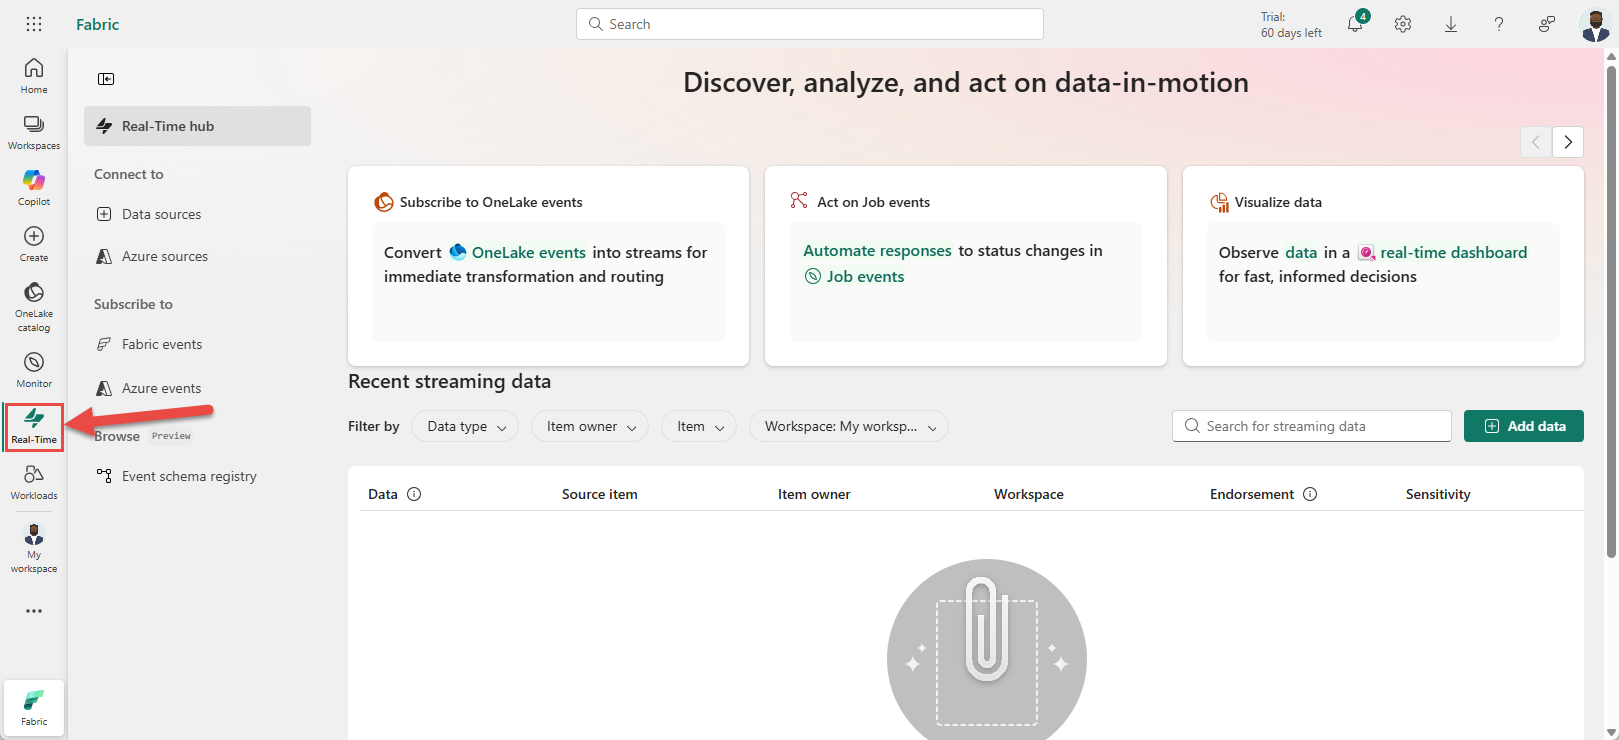
On the Real-Time hub page, select + Data sources under Connect to on the left navigation menu.
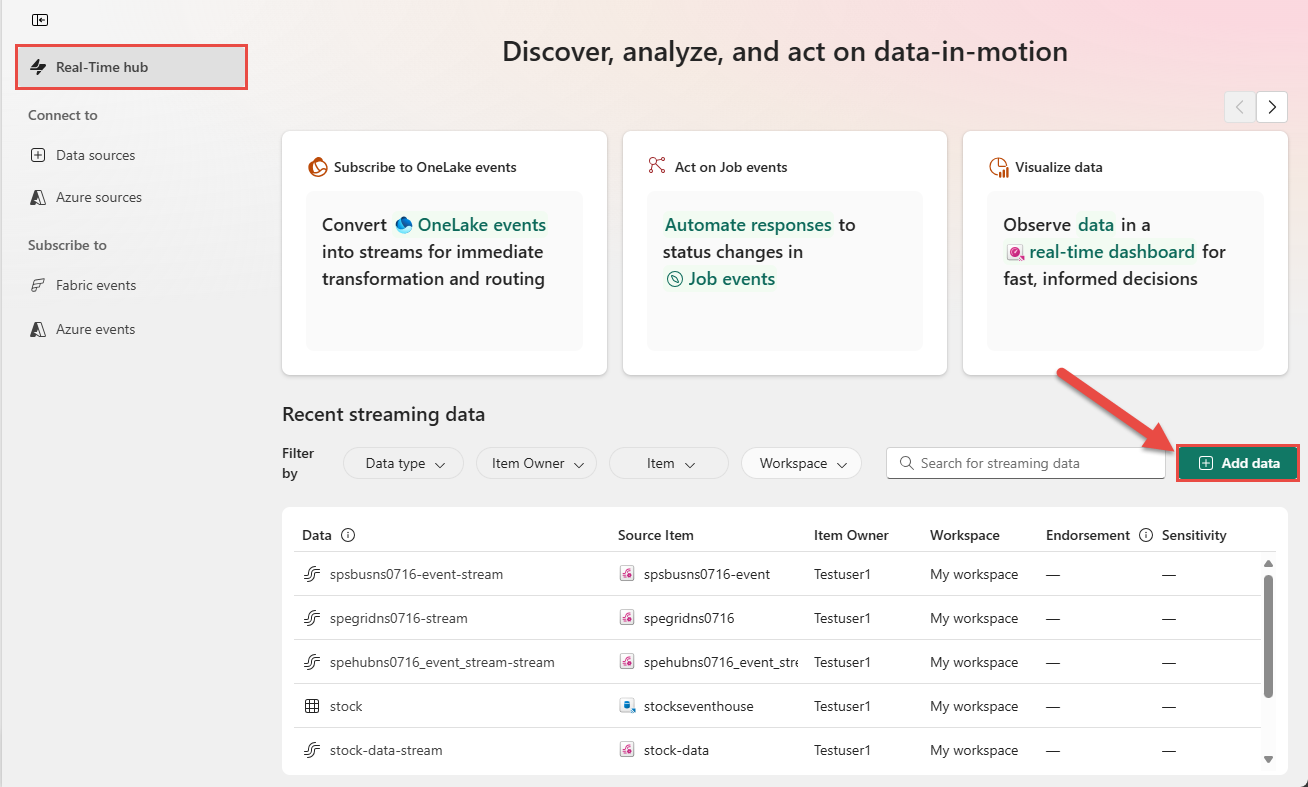
You can also get to the Data sources page from the Real-Time hub page by selecting the + Add data button in the top-right corner.


Add Azure diagnostics source
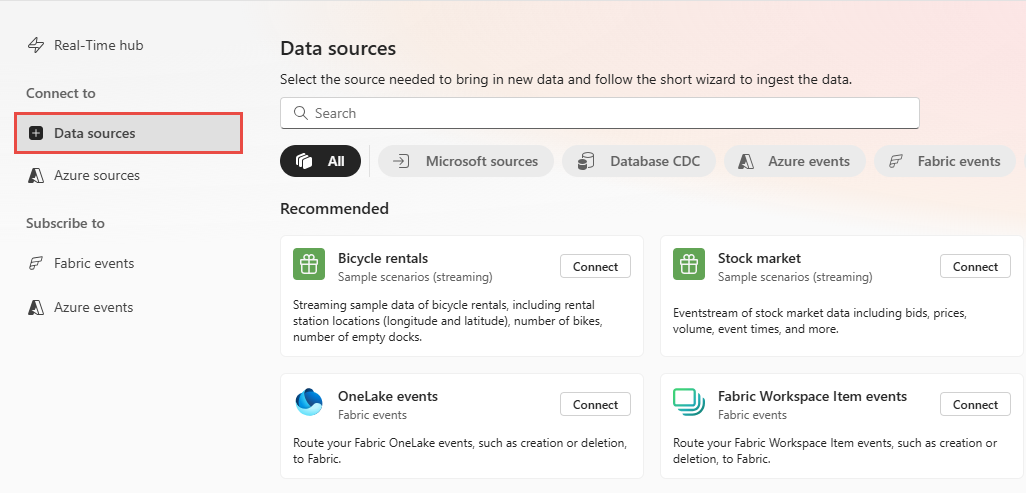
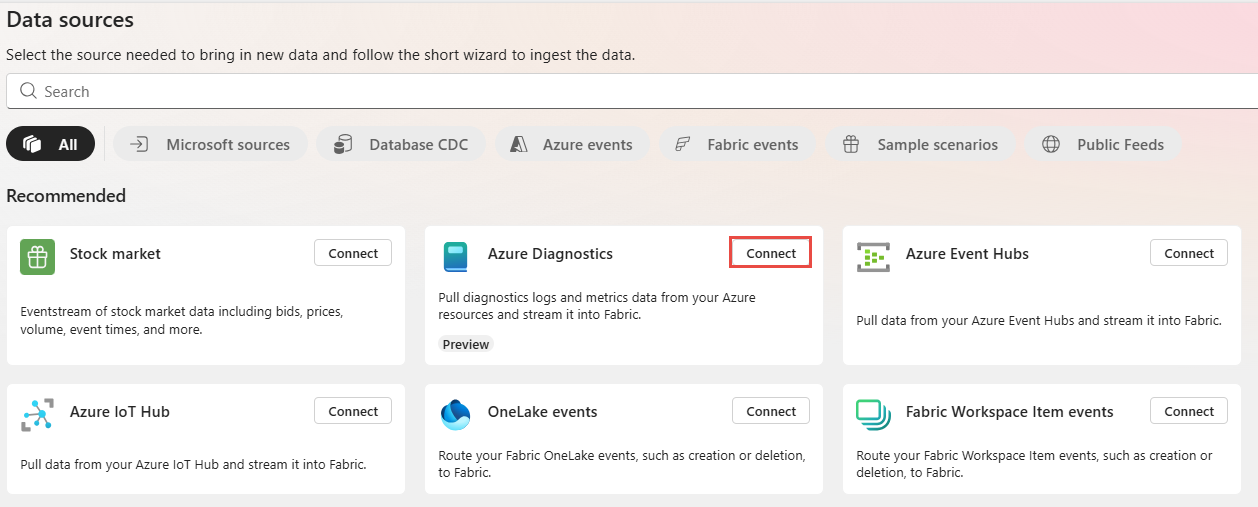
On the Data sources page, select Connect on the Azure Diagnostics tile. If you don't see the tile, use the search box at the top to search for Azure Diagnostics.
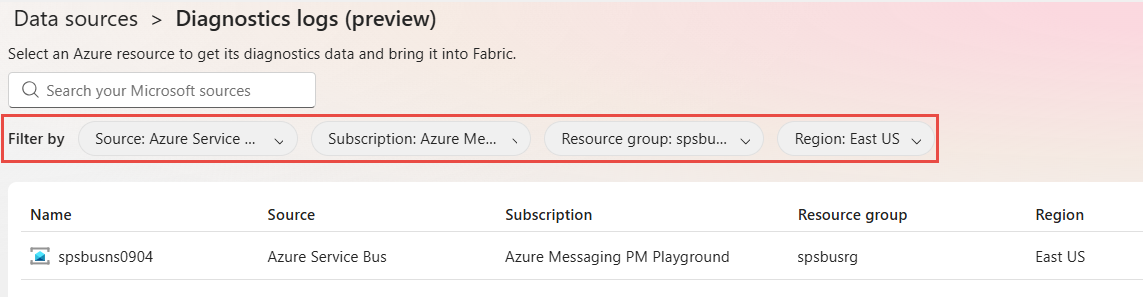
Use the filter drop-down lists at the top to filter the resource list on the source type, Azure subscription, Azure resource group, and region. In the following example, Azure Service Bus is selected for the Source. You can see the types of Azure sources supported in the Source drop-down list.
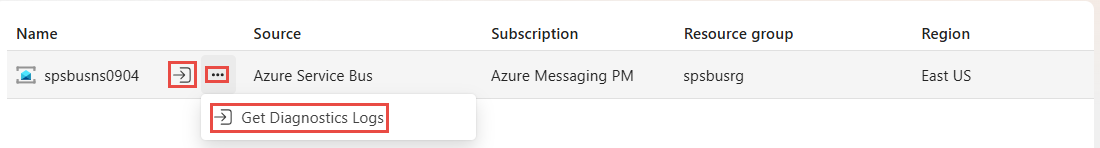
You can use the search box at the top to search for an Azure resource with or without filters.Move the mouse over the Azure resource and select the Connect button (or) select ... (ellipsis) and then select Connect from the menu.
On the Get diagnostic settings page of the Get diagnostics logs wizard, select the logs and metrics you want to stream into Fabric, and then select Next. In the following example, all logs and all metrics are selected. These settings are different for each type of Azure resource.

To stream your diagnostic data into Fabric, a new Event Hubs namespace and a new event hub are automatically created in the same region as the selected resource. The diagnostic information from the source resource is sent to the event hub, which in turn is used to stream data into Fabric. On the Create Azure event hub page:
Review the names of Event Hubs namespace and event hub to be created.
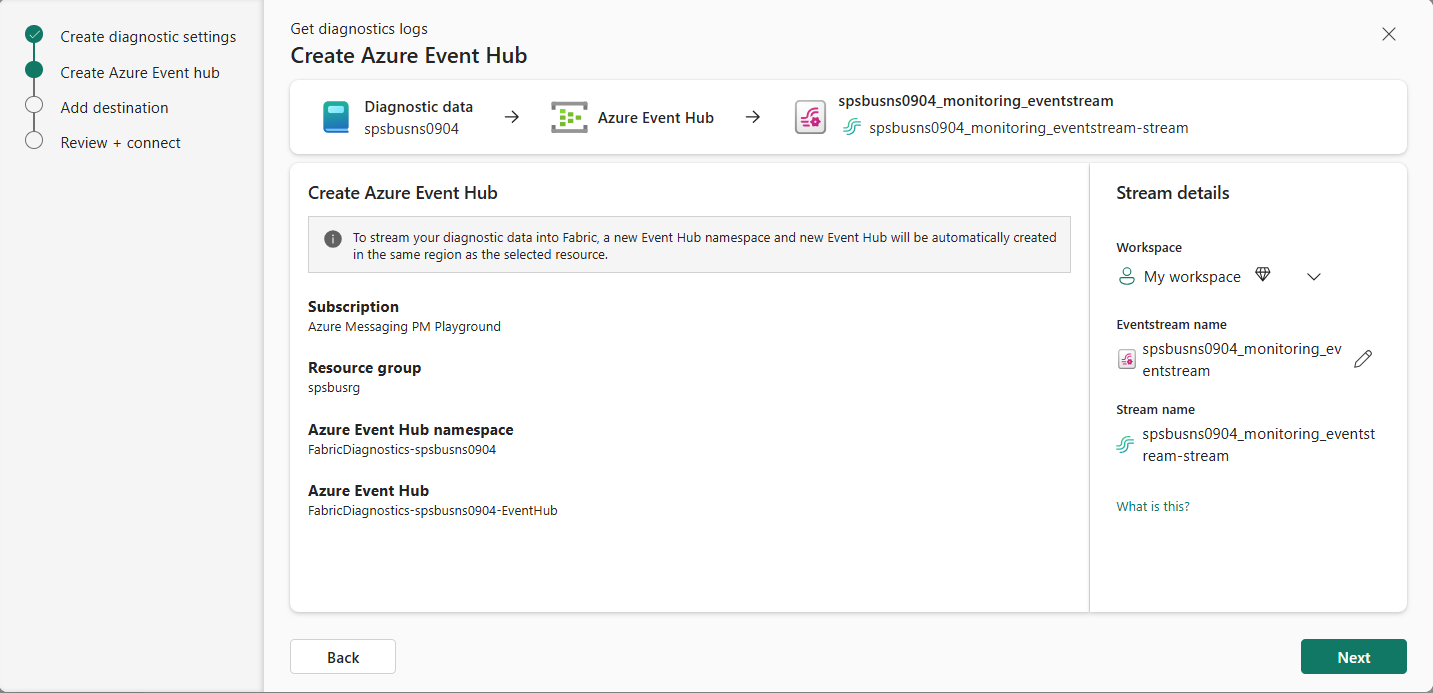
In the right pane, you can use the pencil button to change the name of the eventstream that's being created.
Select Next at the bottom of the page.
This step is optional. On the Add destination page, do these actions:
Select a Fabric workspace that has the target KQL database where you want to store the diagnostic information for the selected resource.
Select the eventhouse in the workspace.
Select the KQL database in the eventhouse.
Select an existing table or create a new table in the KQL database.
Select Activate ingestion immediately after adding the data source if you want to stream the data from the select source resource immediately.
Select Next.

On the Review + connect page, review all the settings, and select Connect.
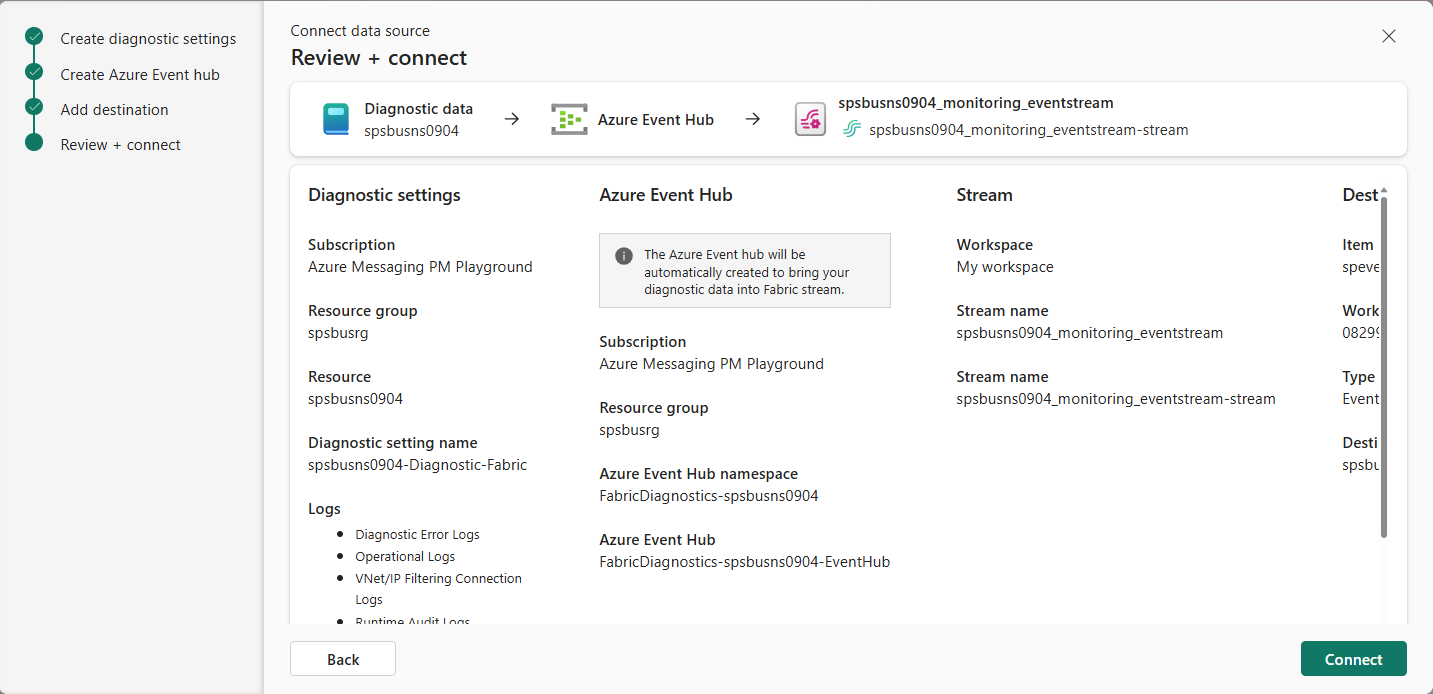
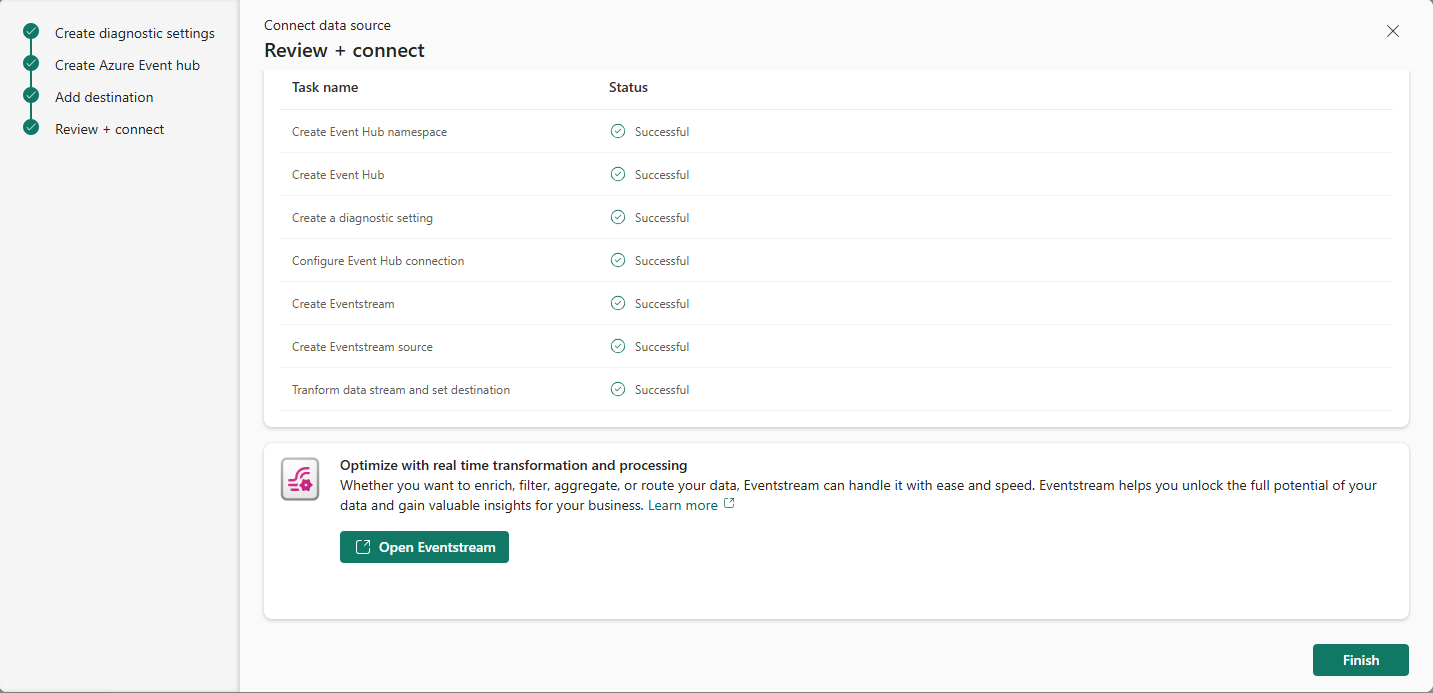
You see the status of each task performed by the wizard:
Creates an Azure Event Hubs namespace.
Creates an event hub in the Event Hubs namespace. This event hub stores the diagnostic information emitted by the selected source resource.
Creates a diagnostic setting on the selected source resource.
Configures the diagnostic setting to send information to the event hub.
Creates an eventstream.
Adds the event hub with the diagnostic information as the source for the eventstream.
Transforms the incoming data such that array of rows are split into separate records, and sets KQL table as the destination to store the result data.


View data stream details
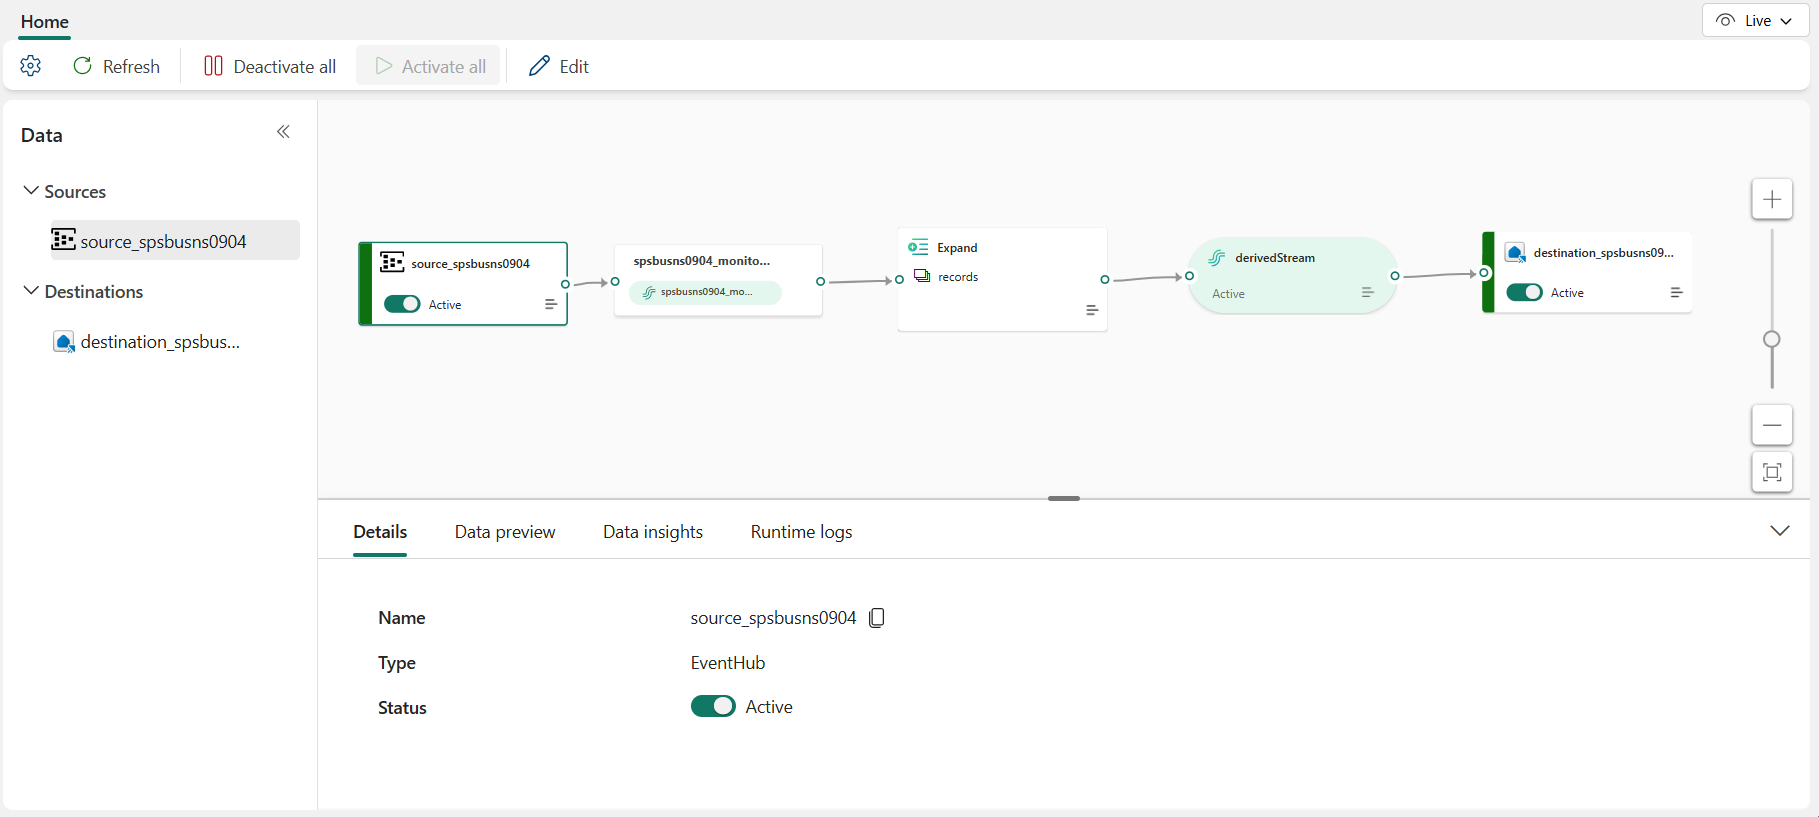
On the Review + connect page, if you select Open eventstream, the wizard opens the eventstream that it created for you with the selected sample data source. Scroll in the status pane to see the Open eventstream link. To close the wizard without opening the eventstream, select Finish at the bottom of the page.
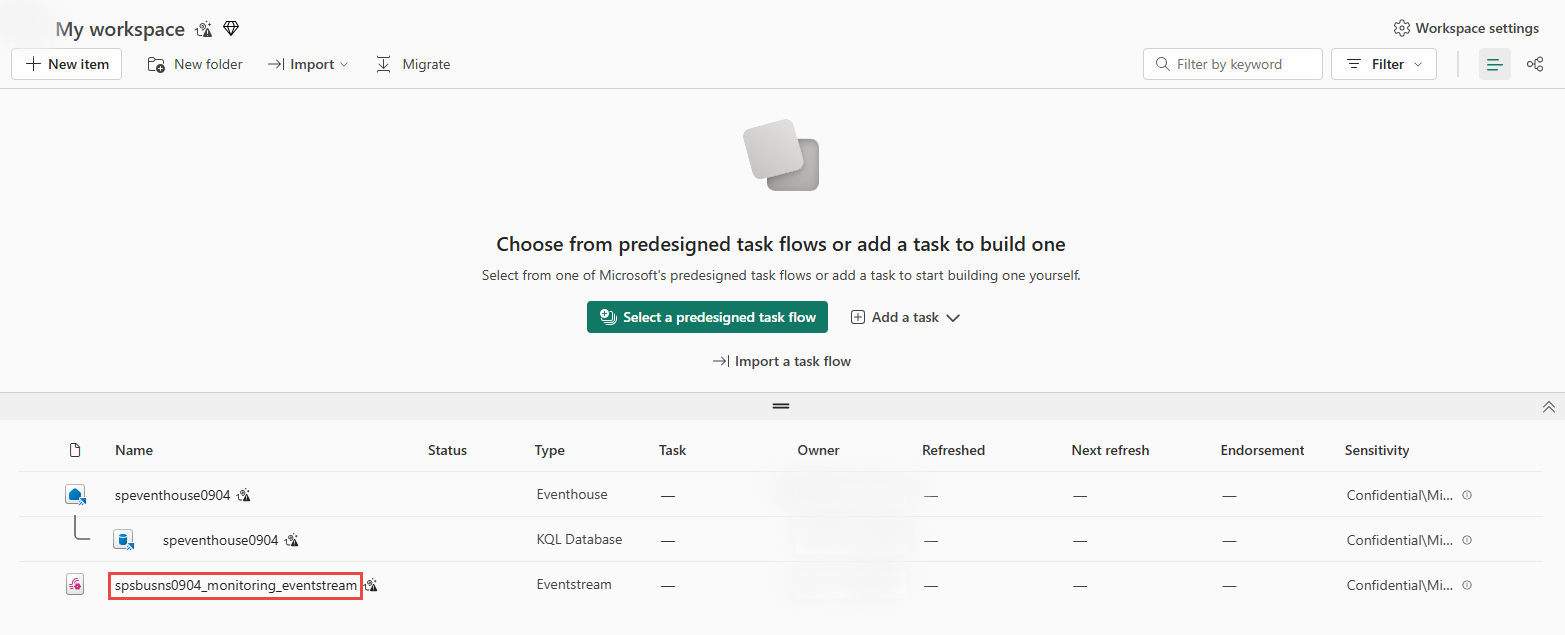
Confirm that you see the newly created data stream on the My workspace page.


Related content
To learn about consuming data streams, see the following articles: