Note
Access to this page requires authorization. You can try signing in or changing directories.
Access to this page requires authorization. You can try changing directories.
OneLake diagnostics provides end-to-end visibility into how data is accessed and used across your Microsoft Fabric environment. It enables organizations to answer critical questions like "who accessed what, when, and how", supporting data governance, operational insight, and compliance reporting.
When enabled at the workspace level, OneLake diagnostics streams data access events as JSON logs into a Lakehouse of your choice within the same capacity. These logs can be easily transformed into analytics-ready Delta tables, allowing teams to build dashboards and reports that track usage patterns, top-accessed items, and trends over time.
As all data in Fabric is unified in OneLake, diagnostics at the workspace level provide a consistent, trustworthy record of data activity—regardless of how or where the data is consumed. This includes:
- User actions in the Fabric web experience
- Programmatic access via APIs, pipelines, and analytics engines
- Cross-workspace shortcuts, with events captured from the source workspace
This unified logging approach ensures that even when data is accessed through shortcuts or across workspaces, visibility is preserved.
Diagnostic events are captured for both Fabric and non-Fabric sources. For access through the Fabric UI and the Blob or Azure Data Lake Storage (ADLS) APIs, every operation is logged. For Fabric workloads access, it records that temporary access was granted, so you can look further in the engine specific logs. This ensures efficient logging while maintaining visibility into how data is consumed across your organization.
Example scenarios supported by OneLake diagnostics
- Security investigation: Track which users accessed sensitive datasets, when, and from where. Helps identify unauthorized access attempts or unusual patterns.
- Performance troubleshooting: Diagnose latency or failure issues by correlating diagnostic events with user actions or system interactions.
- Usage analytics and optimization: Understand which datasets are most frequently accessed, by whom, and how often. Supports data governance and resource optimization.
- Integration monitoring: Monitor external systems interacting with OneLake (via APIs or connectors), ensuring integrations are functioning as expected and diagnosing issues when they arise.
Configuring OneLake diagnostics
Best practice recommendations
To simplify management and improve access control, consider using a dedicated workspace to store diagnostic events. If you're enabling diagnostics across multiple workspaces in the same capacity, consider centralizing logs in a single Lakehouse to make analysis easier.
Prerequisites
- Create a Lakehouse to store OneLake diagnostic events.
- The Lakehouse must reside in the same capacity as the workspaces you want to enable diagnostics for.
- If the workspace uses private links for inbound network protection, it must be within the same virtual network as the Lakehouse.
- You must be a workspace admin for the workspace where you're enabling OneLake diagnostics, and a contributor to the destination Lakehouse.
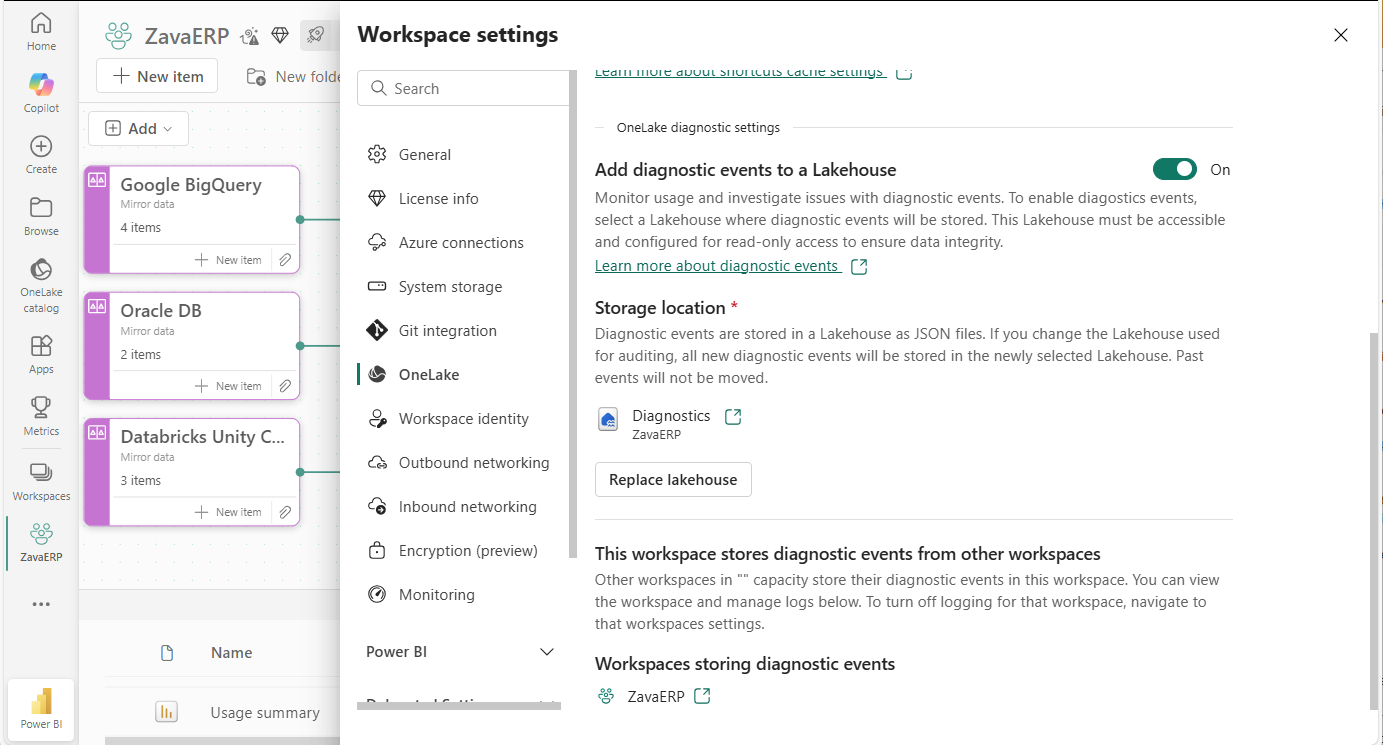
Enabling OneLake diagnostics
Use the following steps to enable OneLake diagnostics:
- Open the workspace settings.
- Navigate to the OneLake settings tab.
- Toggle "Add diagnostic events to a Lakehouse" to On.
- Select the Lakehouse where you want to store the diagnostic events.
Note
It takes up to 1 hour for diagnostic events to begin flowing into the Lakehouse.
Changing the OneLake diagnostic Lakehouse
- Open the workspace settings.
- Go to the OneLake settings tab.
- Select Replace Lakehouse.
- Choose a new Lakehouse.
Note
Previously captured diagnostic events remain in the original Lakehouse. New events are stored in the newly selected Lakehouse.
Disabling OneLake diagnostics
- Open the workspace settings.
- Navigate to the OneLake settings tab.
- Toggle "Add diagnostic events to a Lakehouse" to Off.
Note
The previously selected Lakehouse is retained. If you re-enable diagnostics, it uses the same Lakehouse as before.
OneLake diagnostic events
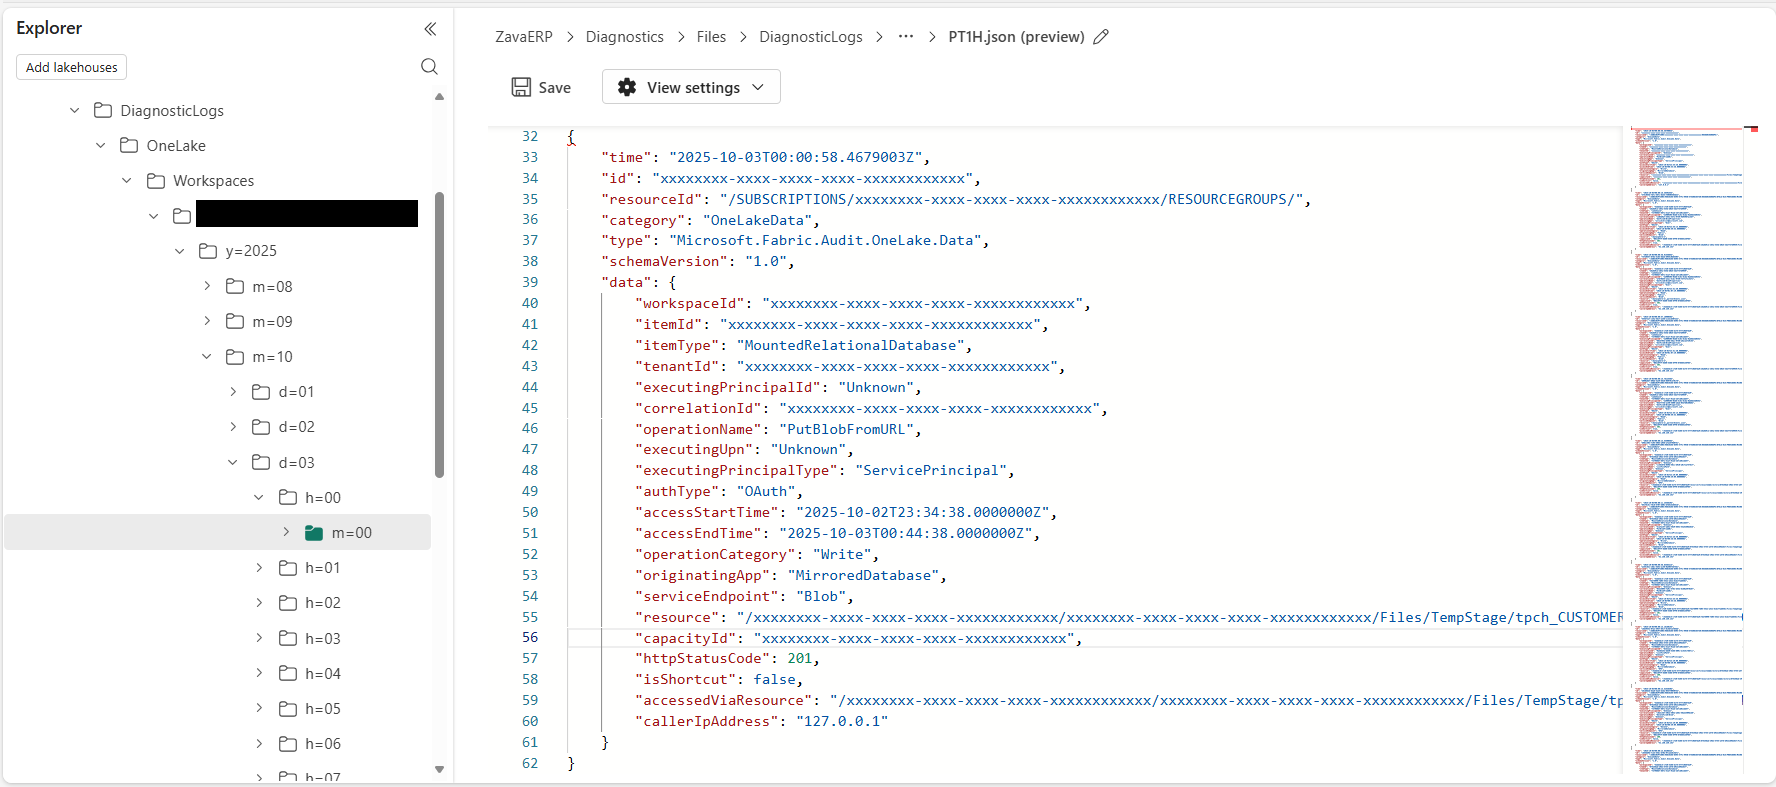
OneLake diagnostic events are stored in the DiagnosticLogs folder within the Files section of a Lakehouse. JSON files are written to a folder with the following path: Files/DiagnosticLogs/OneLake/Workspaces/WorkspaceId/y=YYYY/m=MM/d=DD/h=HH/m=00/PT1H.json
The JSON event contains the following attributes:
| Property | Description |
|---|---|
| workspaceId | The GUID of the workspace with diagnostics enabled. |
| itemId | The GUID of the fabric item, for example the Lakehouse, which is performing the OneLake operation |
| itemType | The kind of item that performed the OneLake operation |
| tenantId | The tenant identifier that performed the OneLake operation |
| executingPrincipalId | The GUID of the Microsoft Entra principle performing the OneLake operation |
| correlationId | A GUID correlation identifier for the OneLake operation |
| operationName | The OneLake operation being performed (not provided for internal Fabric operations) |
| operationCategory | The broad category of the OneLake operation (for example, Read) |
| executingUPN | The Microsoft Entra unique principal name performing the operation (not provided for internal Fabric operations) |
| executingPrincipalType | The type of principal being used, for example User or Service Principal |
| accessStartTime | The time the operation was performed. When temporary access is provided, the time temporary access started |
| accessEndTime | The time the operation was completed. When temporary access is provided, the time temporary access completed |
| originatingApp | The workload performing the operation. For external access, then originatingApp is the user agent string |
| serviceEndpoint | The OneLake service endpoint being used (DFS, Blob or Other) |
| Resource | The resources being accessed (relative to the workspace) |
| capacityId | The identifier of the capacity performing the OneLake operation |
| httpStatusCode | The status code returned to the user |
| isShortcut | Indicates if access was performed via a shortcut |
| accessedViaResource | The resource the data was accessed via. When a shortcut is used, this is the location of the shortcut |
| callerIPAddress | The IP address of the caller |
Personal Data
OneLake diagnostic events include executingUPN and callerIpAddress. To redact this data, tenant admins can disable the setting "Include end-user identifiers in OneLake diagnostic logs" in the Fabric Admin Portal. When disabled, these fields are excluded from new diagnostic events.
Frequently Asked Questions (FAQ)
What happens if the destination Lakehouse is deleted?
If the Lakehouse selected for diagnostics is deleted:
- Diagnostics will be automatically disabled for all workspaces that were pointing to it.
- Previously captured diagnostic data is not deleted—it remains in the deleted Lakehouse's storage until the workspace itself is deleted. To resume diagnostics, select a new Lakehouse in the same workspace. OneLake will enable diagnostics, and all previously captured logs remain accessible.
What happens if the workspace is deleted?
- If a workspace is deleted, OneLake diagnostics for that workspace are also deleted.
- If the workspace is restored, the diagnostic data is restored.
- Once the workspace is permanently deleted, the associated diagnostic events are also permanently removed.
What happens when you change capacities?
- When a workspace is moved to a different capacity, diagnostic logging is disabled.
- You must select a new Lakehouse within the new capacity to re-enable diagnostics.
What happens when BCDR is enabled for the workspace?
- When Business Continuity and Disaster Recovery (BCDR) is enabled, OneLake diagnostics data is replicated to the secondary region, and is accessible via the OneLake APIs if a failover occurs.
Can you audit OneLake diagnostics?
- Yes. When workspace monitoring is enabled, disabled, or the Lakehouse is updated, a ModifyOneLakeDiagnosticSettings event is captured in the Microsoft 365 security logs, allowing you to audit changes to diagnostic settings.
How much consumption does OneLake diagnostics generate?
- OneLake diagnostics is comparable in cost to Azure Storage diagnostics when emitting to a storage account. For the latest details, see the official pricing page: OneLake consumption – Microsoft Fabric | Microsoft Learn.
Limitations
OneLake diagnostics isn't currently compatible with Workspace outbound access protection (OAP) across workspaces. If you require OneLake diagnostics and OAP to work together, you must select a Lakehouse in the same Workspace.
When OneLake diagnostics is configured, the selection of the workspace honors workspace private link configuration by limiting your selection to workspaces within the same private network. However, OneLake diagnostics doesn't automatically respond to networking changes.

