Note
Access to this page requires authorization. You can try signing in or changing directories.
Access to this page requires authorization. You can try changing directories.
Important
This page includes instructions for managing Azure IoT Operations components using Kubernetes deployment manifests, which is in preview. This feature is provided with several limitations, and shouldn't be used for production workloads.
See the Supplemental Terms of Use for Microsoft Azure Previews for legal terms that apply to Azure features that are in beta, preview, or otherwise not yet released into general availability.
OpenTelemetry data flow endpoints are used to send metrics and logs to OpenTelemetry collectors, which can then forward the data to observability platforms like Grafana dashboards and Azure Monitor. You can configure the endpoint settings, authentication, Transport Layer Security (TLS), and batching options.
Prerequisites
- An instance of Azure IoT Operations
- An OpenTelemetry collector deployed and accessible from your Azure IoT Operations cluster
OpenTelemetry endpoint overview
OpenTelemetry endpoints enable you to export telemetry data from Azure IoT Operations dataflows to OpenTelemetry collectors using the OpenTelemetry Protocol (OTLP). This allows you to integrate device and system telemetry into your existing observability infrastructure.
Common scenarios
- Device diagnostics: Export temperature, pressure, and other sensor readings as metrics to monitor device health
- Factory monitoring: Send production line telemetry to Grafana dashboards for operational visibility
- System observability: Forward application logs and metrics to Azure Monitor for centralized monitoring
- Custom metrics: Add contextual attributes like factory ID or location to metrics for better filtering and analysis
Data format requirements
OpenTelemetry endpoints require data to conform to a specific JSON schema with either a metrics array, a logs array, or both. Messages that don't conform to this schema are dropped and acknowledged to prevent message loss.
The JSON payload must use this top-level structure:
{
  "metrics": [ /* array of metric objects */ ],
  "logs": [ /* array of log objects */ ]
}
At least one of metrics or logs must be present.
All incoming messages are validated against the required schema. Messages that fail validation are dropped, acknowledged back to the broker, and logged for troubleshooting. Common validation failures include missing required fields, invalid data types, unsupported metric types or log levels, and malformed timestamps. If MQTT messages include expiration timestamps, expired messages are filtered out before processing.
Metrics format
Each metric object in the metrics array must contain the following fields:
Required fields:
name(string): The metric nametype(string): The metric type (see supported metric types)value(number): The numeric value of the metric
Optional fields:
description(string): Human-readable description of the metrictimestamp(number): Unix epoch timestamp in nanoseconds when the metric was recordedattributes(array): Key-value pairs for metric labeling and filtering
{
  "metrics": [
    {
      "name": "temperature",
      "description": "The temperature reading from sensor",
      "type": "f64_gauge",
      "value": 72.5,
      "timestamp": 1754851200000000000,
      "attributes": [
        {
          "key": "factoryId",
          "value": "factory1"
        },
        {
          "key": "location",
          "value": "warehouse"
        }
      ]
    }
  ]
}
Each attribute in the attributes array must have:
key(string): The attribute namevalue(string): The attribute value (must be a string)
Logs format
Each log object in the logs array must contain the following fields:
Required fields:
value(string): Log message contentlevel(string): Log level (see supported log levels)
Optional fields:
timestamp(number): Unix epoch timestamp in nanoseconds when the log was recordedattributes(array): Key-value pairs for log context and filtering
{
  "logs": [
    {
      "value": "Device temperature sensor initialized",
      "level": "info",
      "timestamp": 1754851200000000000,
      "attributes": [
        {
          "key": "deviceId",
          "value": "sensor001"
        },
        {
          "key": "component",
          "value": "temperature-sensor"
        }
      ]
    }
  ]
}
Each attribute in the attributes array must have:
key(string): The attribute namevalue(string): The attribute value (must be a string)
Supported metric types
The following OpenTelemetry metric types are supported:
- Counters:
u64_counter,f64_counter- Monotonically increasing values - Up/down counters:
i64_up_down_counter,f64_up_down_counter- Values that can increase or decrease - Gauges:
u64_gauge,i64_gauge,f64_gauge- Point-in-time values - Histograms:
f64_histogram,u64_histogram- Distribution of values
Supported log levels
The following log levels are supported:
tracedebuginfowarnerrorfatal
Create OpenTelemetry endpoint
You can create an OpenTelemetry dataflow endpoint using the operations experience, Bicep, or Kubernetes.
To create an OpenTelemetry dataflow in the operations experience, go to the Dataflow endpoints.
From the data flow endpoints page, identify Open Telemetry and select + New.

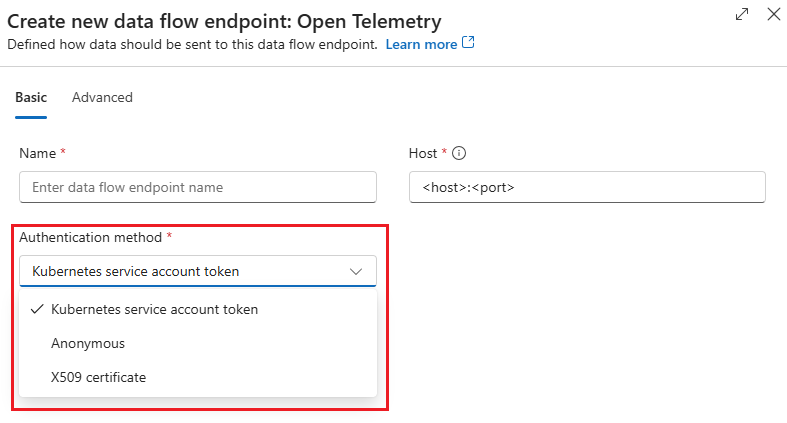
In the Create new data flow endpoint: Open Telemetry pane, select the Basic configuration tab and provide the following information:
- Name: A unique name for the endpoint.
- Host: The OpenTelemetry collector endpoint in the format
<host>:<port>, for example,otel-collector.monitoring.svc.cluster.local:4317. - Authentication method: Choose one of the following authentication methods:
- Kubernetes service account token: Uses Kubernetes service account tokens to authenticate with the OpenTelemetry collector. Provide the audience value for your OpenTelemetry collector configuration. See Service Account Token (SAT) for more details.
- Anonymous: Use when the OpenTelemetry collector doesn't require authentication.
- X509 certificate: Uses client certificates for mutual TLS authentication. Provide the name of a Kubernetes secret containing your client certificate. See X.509 certificate for more details.
Select the Advanced configuration tab and provide the following information:
- Batching latency (in seconds): Maximum time to wait before sending a batch. Default is 5 seconds.
- Message count: Maximum number of messages in a batch. Default is 100000 messages.
- TLS mode: Choose one of the following TLS modes:
- Enabled: Enables TLS for secure communication with the OpenTelemetry collector. Provide the name of a Kubernetes ConfigMap containing your trusted CA certificate.
- Disabled: Disables TLS.
- Trusted CA certificate config map name: The name of a Kubernetes ConfigMap containing your trusted CA certificate.

Select Apply to create the OpenTelemetry endpoint.
Configuration options
This section describes configuration options for OpenTelemetry data flow endpoints.
Host
The host property specifies the OpenTelemetry collector endpoint URL. Include the protocol (http:// or https://) and port number.
Examples:
https://otel-collector.monitoring.svc.cluster.local:4317http://localhost:4317https://otel-collector:4317
Authentication
OpenTelemetry endpoints support several authentication methods to connect securely to collectors.
Service Account Token (SAT)
Service account token (SAT) authentication uses Kubernetes service account tokens to authenticate with the OpenTelemetry collector.
Replace <OTEL_AUDIENCE> with the audience value for your OpenTelemetry collector configuration. This value must match the expected audience on the collector.
In the Create new data flow endpoint: Open Telemetry pane, under the Basic configuration tab, select Kubernetes service account token as the authentication method.
Provide the Service audience value for your OpenTelemetry collector configuration.

Important
You can only choose the authentication method when creating a new OpenTelemetry data flow endpoint. You can't change the authentication method after the OpenTelemetry data flow endpoint is created. If you want to change the authentication method of an existing data flow, delete the original data flow and create a new one with the new authentication method.
X.509 certificate
X.509 certificate authentication uses client certificates for mutual TLS authentication.
In the Create new data flow endpoint: Open Telemetry pane, under the Basic configuration tab, select X509 certificate as the authentication method.
Provide the following information from Azure Key Vault:
- Synced secret name: The name of a Kubernetes secret containing your client certificate.
- X509 client certificate: The client certificate.
- X509 client key: The private key for the client certificate.
- X509 intermediate certificates: The intermediate certificates for the client certificate chain.

Before you use X.509 certificate authentication, create a Kubernetes secret with your client certificate:
kubectl create secret tls <X509_SECRET_NAME> \
  --cert=client.crt \
  --key=client.key \
  -n azure-iot-operations
Anonymous authentication
Anonymous authentication is used when the OpenTelemetry collector doesn't require authentication.
In the Create new data flow endpoint: Open Telemetry pane, under the Basic configuration tab, select Anonymous as the authentication method. No additional settings are required.
TLS configuration
Configure Transport Layer Security (TLS) settings for secure communication with the OpenTelemetry collector.
Enabled TLS with trusted CA
- In the Create new data flow endpoint: Open Telemetry pane, under the Advanced configuration tab, select Enabled as the TLS mode.
- In Trusted CA certificate config map name provide the name of a Kubernetes ConfigMap containing your trusted CA certificate.
Disabled TLS
In the Create new data flow endpoint: Open Telemetry pane, under the Advanced configuration tab, select Disabled as the TLS mode.
Batching
Configure batching settings to optimize performance by grouping multiple messages before sending to the collector.
In the Create new data flow endpoint: Open Telemetry pane, under the Advanced configuration tab, provide the following batching settings:
- Batching latency (in seconds): Maximum time to wait before sending a batch. Default is 5 seconds.
- Message count: Maximum number of messages in a batch. Default is 100000 messages.
Error handling and troubleshooting
Message validation
OpenTelemetry endpoints validate incoming messages against the required schema. Invalid messages are dropped and acknowledged to prevent message loss in the dataflow pipeline.
Common validation errors:
- Missing required fields (
name,type,valuefor metrics;value,levelfor logs) - Invalid metric types or log levels
- Non-numeric values in metric
valuefields - Malformed timestamp values
Delivery guarantees
The OpenTelemetry endpoint provides delivery guarantees to the collector itself, but not to upstream services that the collector can forward data to. Once data reaches the collector, Azure IoT Operations doesn't have visibility into whether it reaches the final destination.