Note
Access to this page requires authorization. You can try signing in or changing directories.
Access to this page requires authorization. You can try changing directories.
In this article, you learn how to set up Azure Monitor logging for LLM API requests and responses in Azure API Management.
The API Management administrator can use LLM API request and response logs along with API Management gateway logs for scenarios such as the following:
Calculate usage for billing - Calculate usage metrics for billing based on the number of tokens consumed by each application or API consumer (for example, segmented by subscription ID or IP address).
Inspect messages - Inspect and analyze prompts and completions to help with debugging, auditing, and model evaluation.
Learn more about:
Prerequisites
- An Azure API Management instance.
- A managed LLM chat completions API integrated with Azure API Management. For example, Import an Azure AI Foundry API.
- Access to an Azure Log Analytics workspace.
- Appropriate permissions to configure diagnostic settings and access logs in API Management.
Enable diagnostic setting for LLM API logs
Enable a diagnostic setting to log requests that the gateway processes for large language model REST APIs. For each request, Azure Monitor receives data about token usage (prompt tokens, completion tokens, and total tokens), the name of the model used, and optionally the request and response messages (prompt and completion). Large requests and responses are split into multiple log entries with sequence numbers for later reconstruction if needed.
The following are brief steps to enable a diagnostic setting that directs LLM API logs to a Log Analytics workspace. For more information, see Enable diagnostic setting for Azure Monitor logs.
- In the Azure portal, navigate to your Azure API Management instance.
- In the left menu, under Monitoring, select Diagnostic settings > + Add diagnostic setting.
- Configure the setting to send AI gateway logs to a Log Analytics workspace:
- Under Logs, select Logs related to generative AI gateway.
- Under Destination details, select Send to Log Analytics workspace.
- Review or configure other settings and make changes if needed.
- Select Save.

Enable logging of requests or responses for LLM API
You can enable diagnostic settings for all APIs or customize logging for specific APIs. The following are brief steps to log both LLM requests and response messages for an API. For more information, see Modify API logging settings.
- In the left menu of your API Management instance, select APIs > APIs and then select the name of the API.
- Select the Settings tab from the top bar.
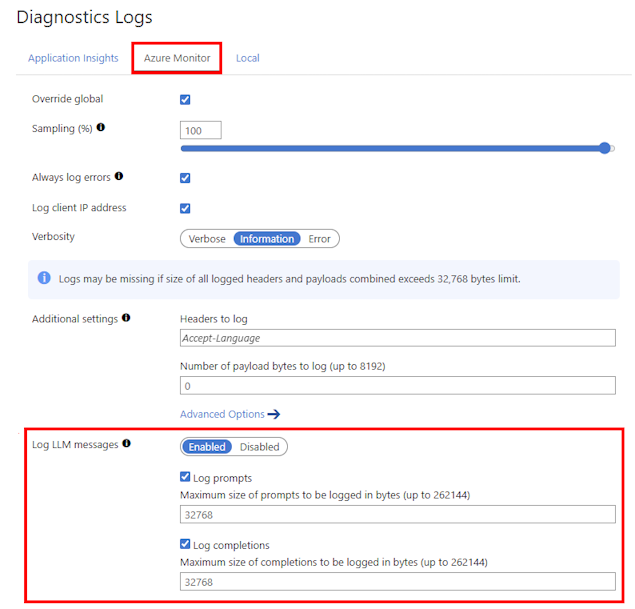
- Scroll down to the Diagnostic Logs section, and select the Azure Monitor tab.
- In Log LLM messages, select Enabled.
- Select Log prompts and enter a size in bytes, such as 32768.
- Select Log completions and enter a size in bytes, such as 32768.
- Review other settings and make changes if needed. Select Save.
Note
If you enable collection, LLM request or response messages up to 32 KB in size are sent in a single entry. Messages larger than 32 KB are split and logged in 32 KB chunks with sequence numbers for later reconstruction. Request messages and response messages can't exceed 2 MB each.
Review analytics workbook for LLM APIs
The Azure Monitor-based Analytics dashboard provides insights into LLM API usage and token consumption using data aggregated in a Log Analytics workspace. Learn more about Analytics in API Management.
- In the left menu of your API Management instance, select Monitoring > Analytics.
- Select the Language models tab.
- Review metrics and visualizations for LLM API token consumption and requests in a selected Time range.

Review Azure Monitor logs for requests and responses
Review the ApiManagementGatewayLlmLog log for details about LLM requests and responses, including token consumption, model deployment used, and other details over specific time ranges.
Requests and responses (including chunked messages for large requests and responses) appear in separate log entries that you can correlate by using the CorrelationId field.
For auditing purposes, use a Kusto query similar to the following query to join each request and response in a single record. Adjust the query to include the fields that you want to track.
ApiManagementGatewayLlmLog
| extend RequestArray = parse_json(RequestMessages)
| extend ResponseArray = parse_json(ResponseMessages)
| mv-expand RequestArray
| mv-expand ResponseArray
| project
    CorrelationId,
    RequestContent = tostring(RequestArray.content),
    ResponseContent = tostring(ResponseArray.content)
| summarize
    Input = strcat_aray(make_list(RequestContent), " . "),
    Output = strcat_array(make_list(ResponseContent), " . ")
    by CorrelationId
| where isnotempty(Input) and isnotempty(Output)

Upload data to Azure AI Foundry for model evaluation
You can export LLM logging data as a dataset for model evaluation in Azure AI Foundry. With model evaluation, you can assess the performance of your generative AI models and applications against a test model or dataset using built-in or custom evaluation metrics.
To use LLM logs as a dataset for model evaluation:
- Join LLM request and response messages into a single record for each interaction, as shown in the previous section. Include the fields you want to use for model evaluation.
- Export the dataset to CSV format, which is compatible with Azure AI Foundry.
- In the Azure AI Foundry portal, create a new evaluation to upload and evaluate the dataset.
For details to create and run a model evaluation in Azure AI Foundry, see Evaluate generative AI models and applications by using Azure AI Foundry.