你当前正在访问 Microsoft Azure Global Edition 技术文档网站。 如果需要访问由世纪互联运营的 Microsoft Azure 中国技术文档网站,请访问 https://docs.azure.cn。
了解如何查看可提供 AI 应用程序执行可见性的跟踪结果。 使用跟踪诊断不准确的工具调用、误导性提示、延迟瓶颈和低质量评估分数。
在这篇文章中,你将学会如何:
- 为项目启用跟踪。
- 实施 OpenAI SDK。
- 捕获消息内容(可选)。
- 查看跟踪时间线和跨度。
- 将跟踪与评估循环连接起来。
本文介绍如何在 Azure AI Foundry 中使用 OpenAI SDK 和 OpenTelemetry 查看 AI 应用程序的跟踪结果。
Prerequisites
需要满足以下条件才能完成本教程:
已创建 Azure AI Foundry 项目。
一个使用 OpenAI SDK 调用 Azure AI Foundry 中托管的模型的 AI 应用程序。
在项目中启用跟踪
Azure AI Foundry 使用 OpenTelemetry 在 Azure Application Insights 中存储跟踪。 新的资源不会自动配置 Application Insights。 每个 Azure AI Foundry 资源关联(或创建)资源一次。
以下步骤演示如何配置资源:
转到 Azure AI Foundry 门户 并导航到项目。
在侧导航栏上,选择“跟踪”。
如果 Azure Application Insights 资源未与 Azure AI Foundry 资源关联,请关联一个资源。 如果你已关联一个 Application Insights 资源,则不会看到下面的启用页面,你可以跳过此步骤。
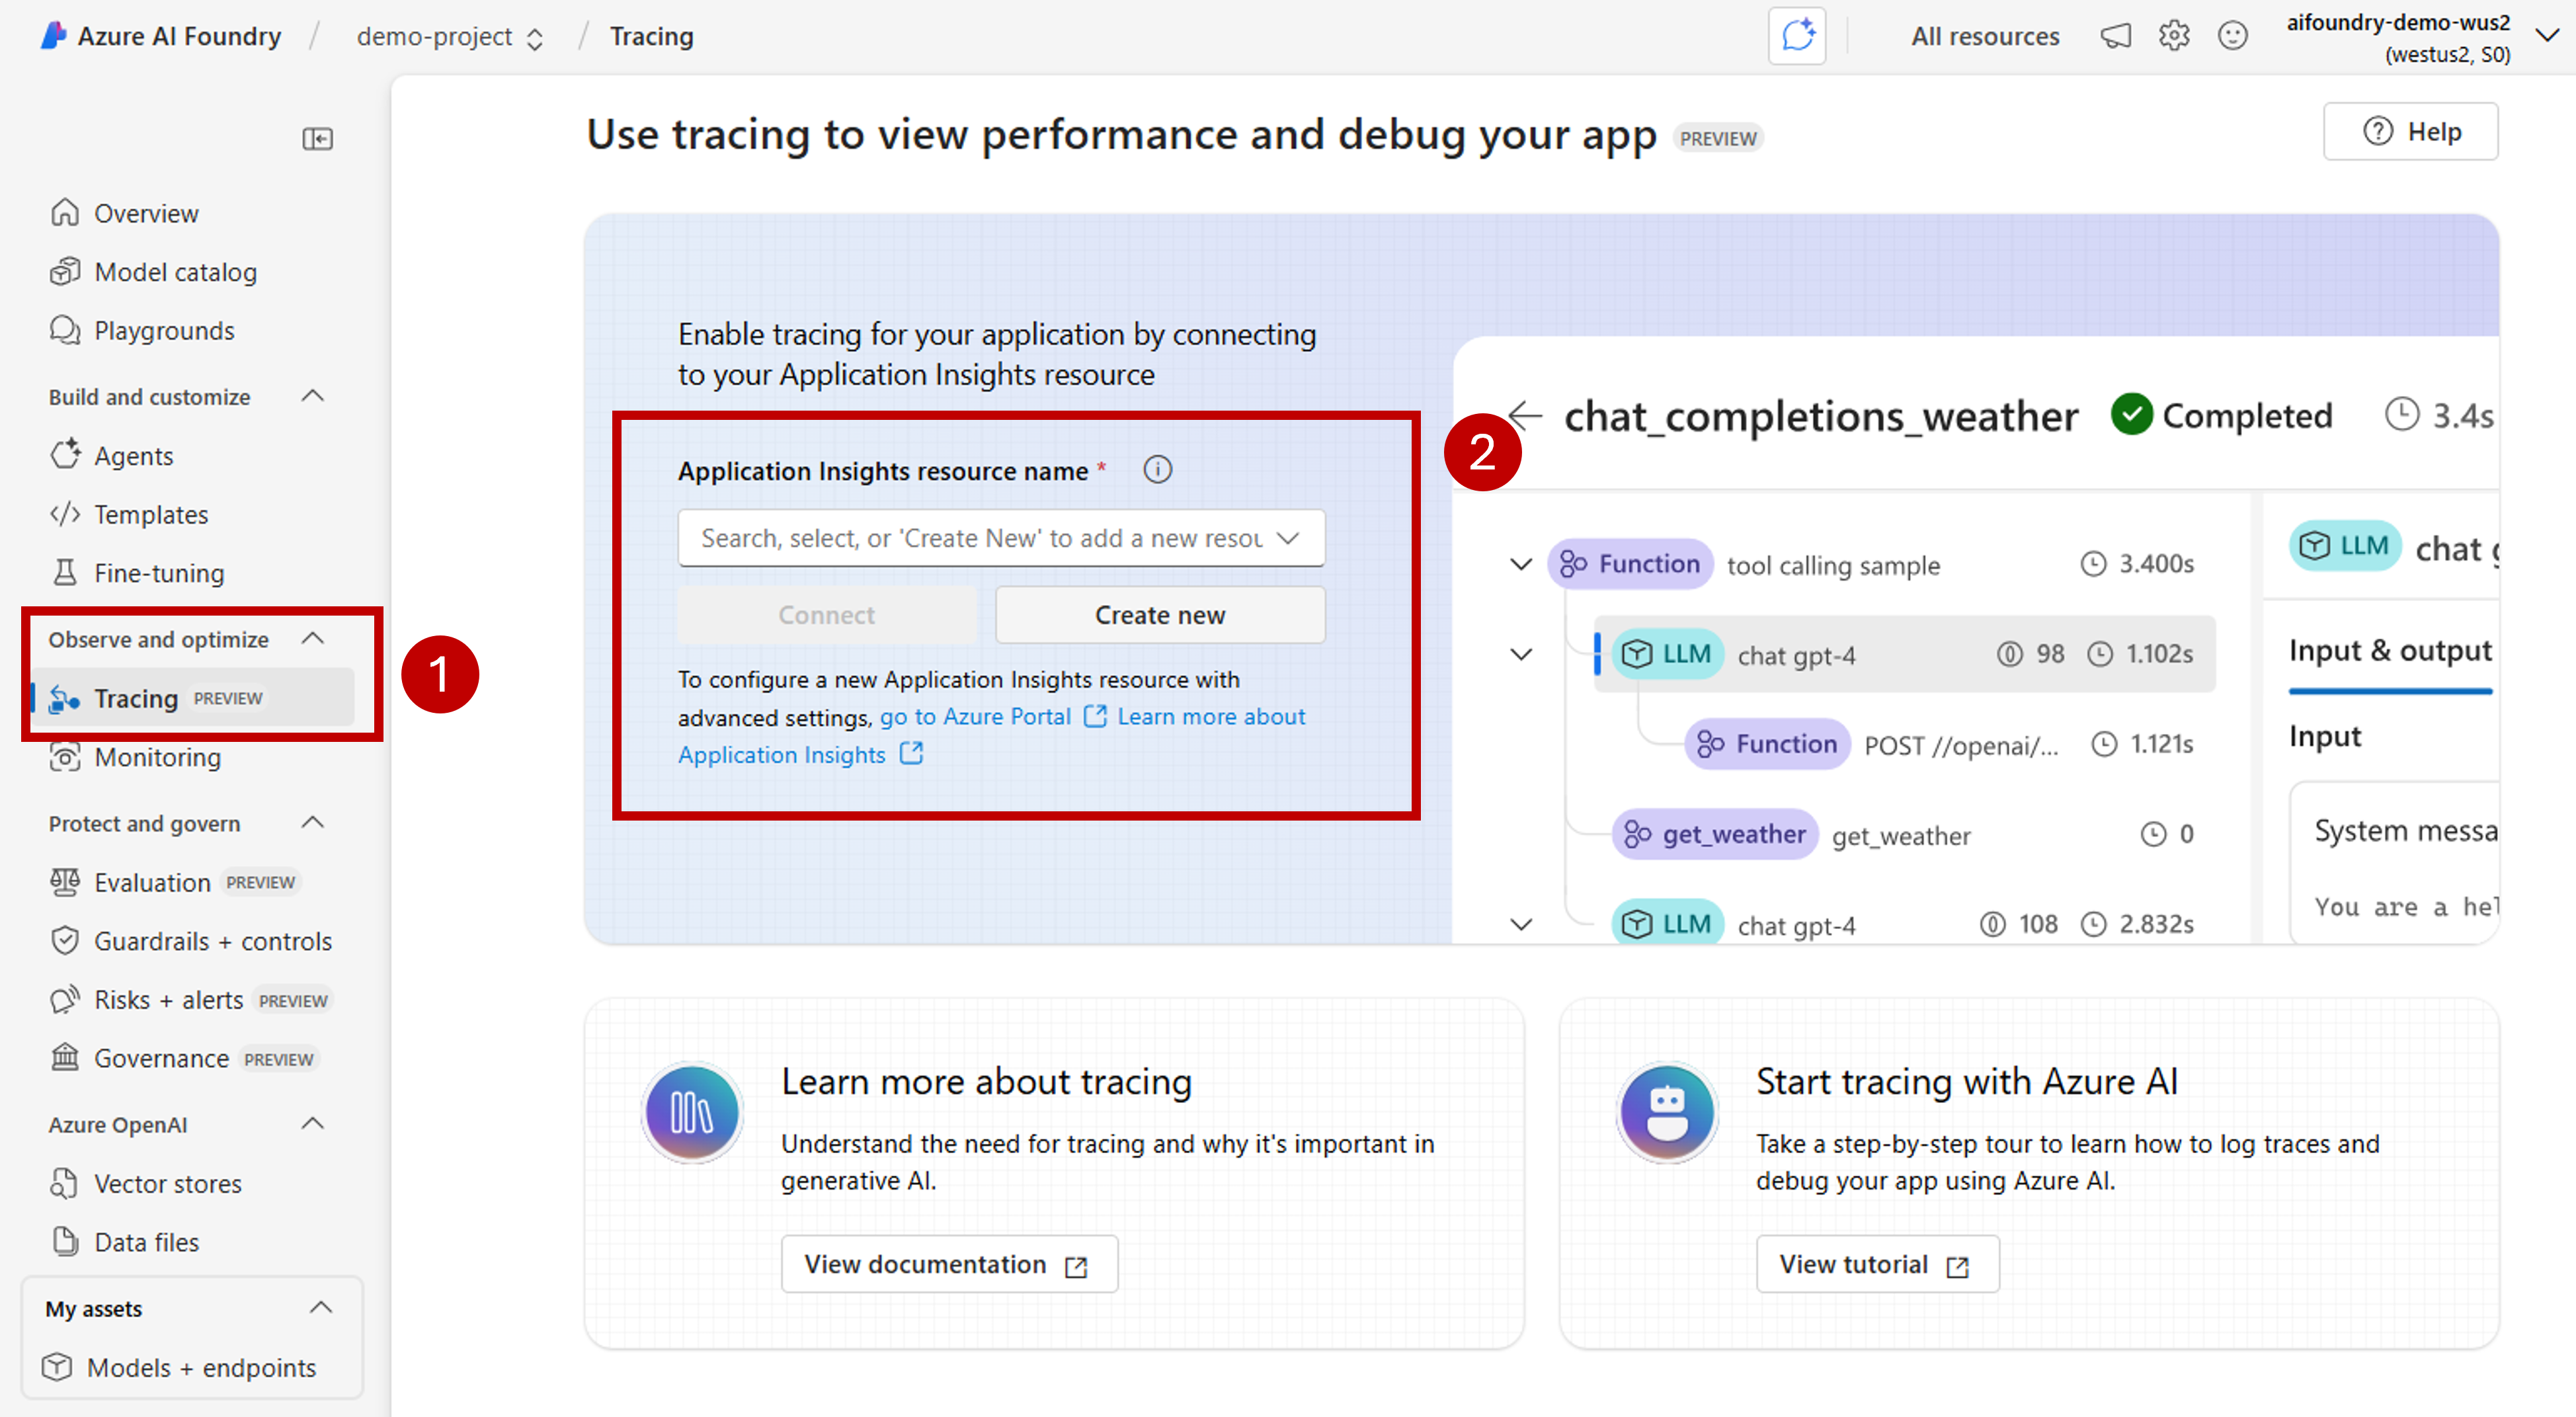
若要重复使用现有的 Azure Application Insights,请使用下拉列表 Application Insights 资源名称 查找资源并选择 “连接”。
Tip
若要连接到现有的 Azure Application Insights,至少需要对 Azure AI Foundry 资源(或中心)的参与者访问权限。
若要连接到新的 Azure Application Insights 资源,请选择“新建”选项。
使用配置向导配置新资源的名称。
默认情况下,新资源是在创建 Azure AI Foundry 资源的同一资源组中创建的。 使用“高级设置”选项配置一个不同的资源组或订阅。
Tip
若要创建新的 Azure Application Insights 资源,你还需要具有所选资源组(或默认资源组)的参与者角色。
选择“创建”来创建资源并将其连接到 Azure AI Foundry 资源。
配置连接后,即可在资源中的任何项目中使用跟踪。
Tip
确保你在 Application Insights 资源中分配有 Log Analytics 读者角色。 若要详细了解如何分配角色,请参阅 使用 Azure 门户分配 Azure 角色。 使用 Microsoft Entra 组 更轻松地管理用户的访问权限。
转到项目的登陆页并复制项目的终结点 URI。 稍后需要用到此信息。
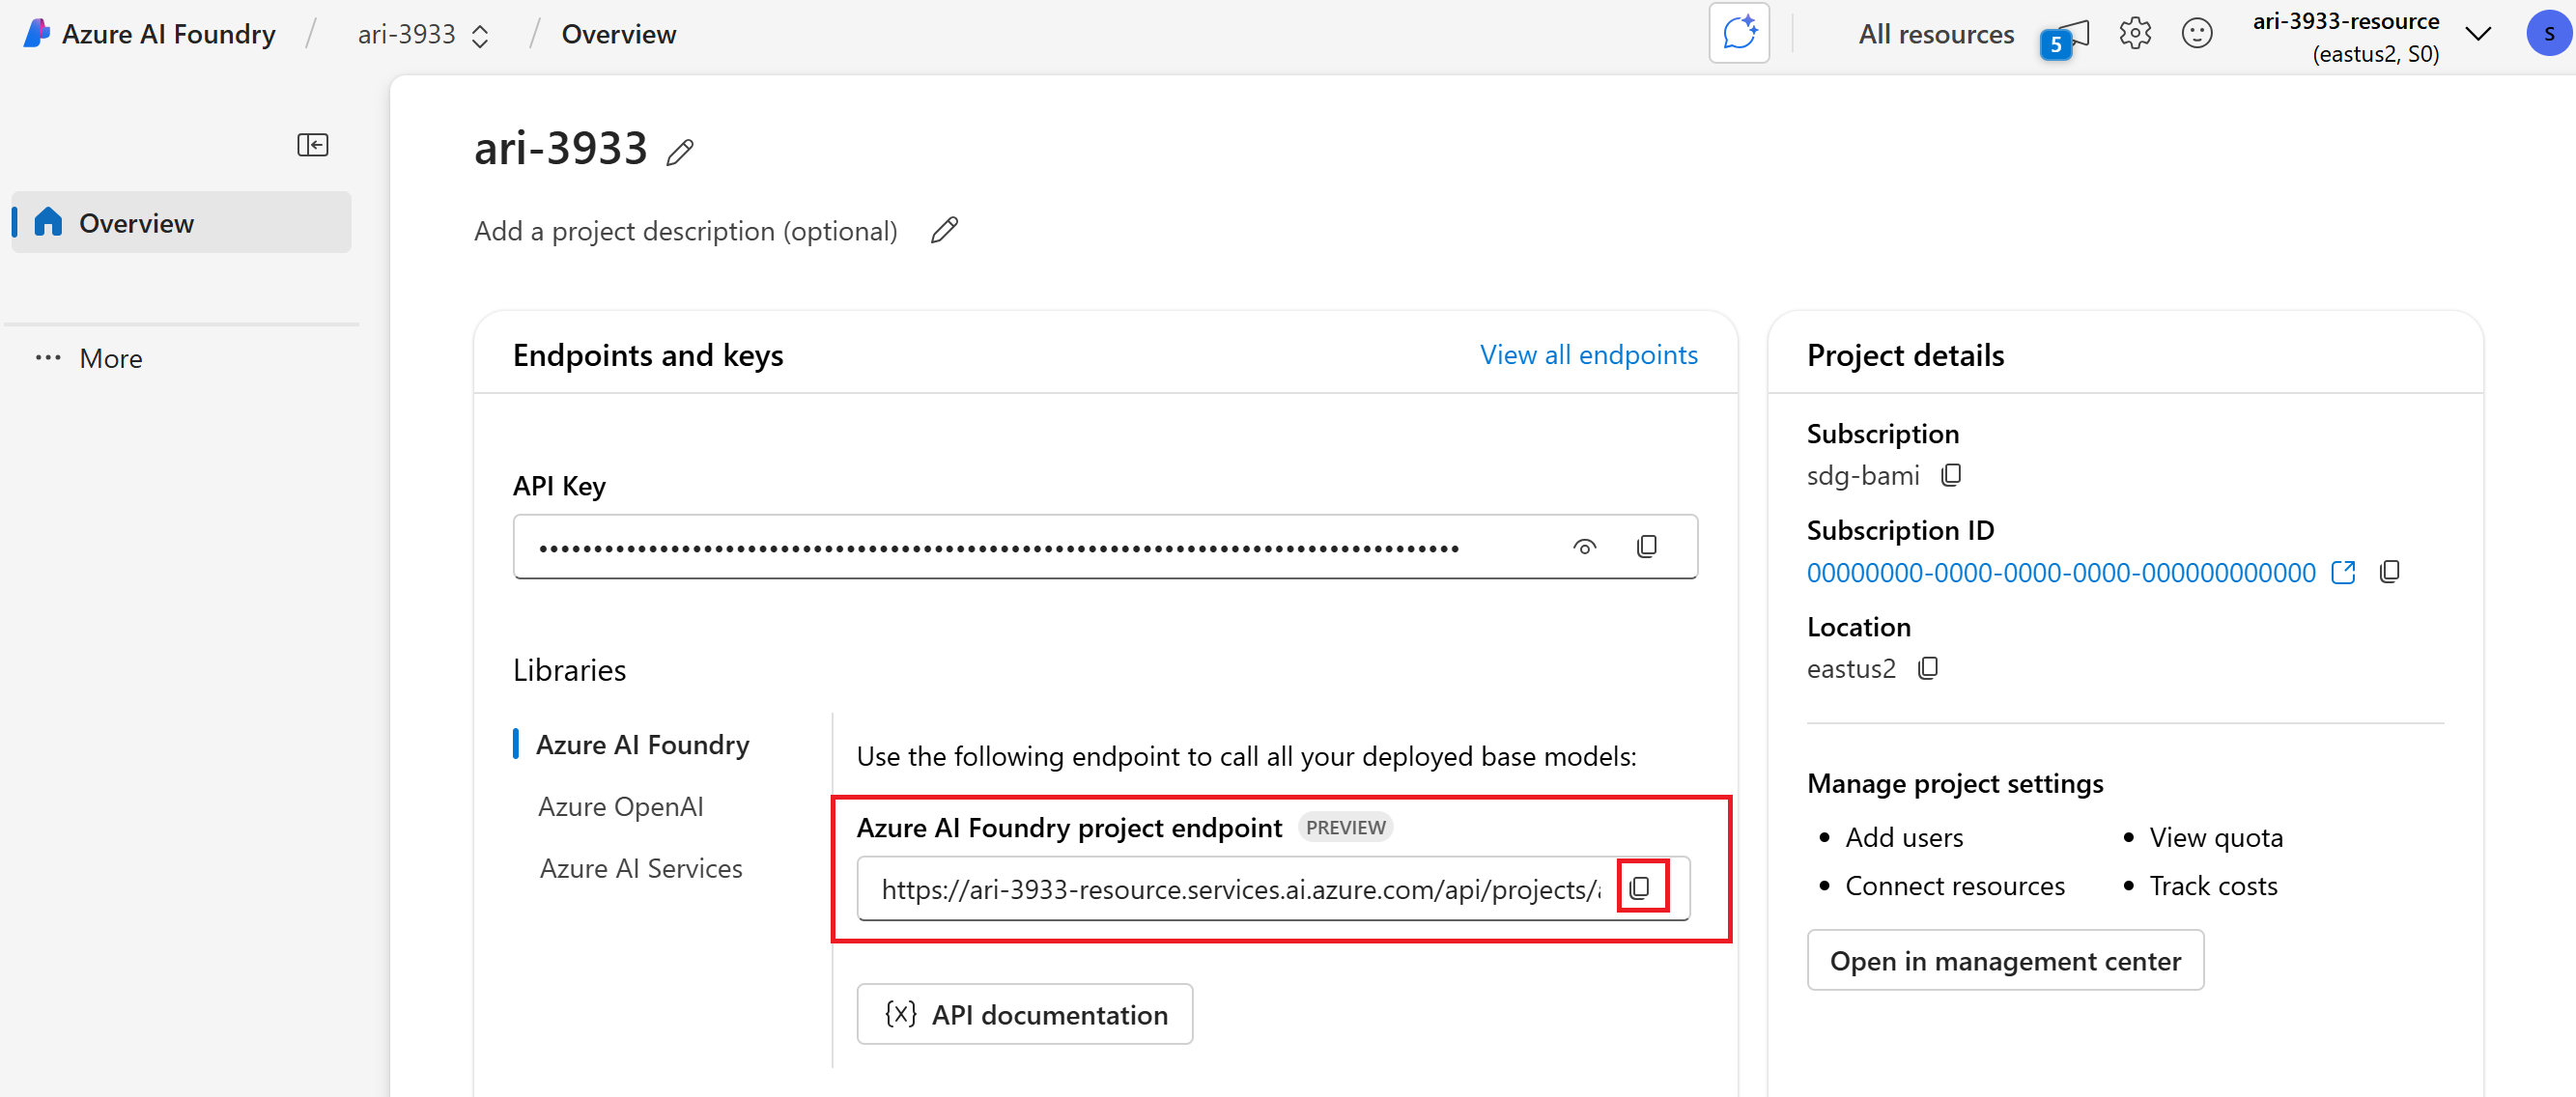
Important
要使用项目的端点,需要在应用程序中配置 Microsoft Entra ID。 如果未配置 Entra ID,请使用本教程的步骤 3 所示的 Azure Application Insights 连接字符串。


在 Azure AI Foundry 门户中查看跟踪结果
配置跟踪并检测应用程序后,可以在 Azure AI Foundry 门户中查看跟踪结果:
转到 Azure AI Foundry 门户 并导航到项目。
在侧导航栏上,选择“跟踪”。
你将看到你的工具化应用程序的跟踪结果列表。 每个记录显示:
- 跟踪 ID:跟踪的唯一标识符
- 开始时间:跟踪开始时间
- 持续时间:操作所用的时间
- 状态:成功或失败状态
- 操作:跟踪中的跨度数量
选择任何跟踪以查看详细的跟踪结果,包括:
- 完成执行时间表
- 每个操作的输入和输出数据
- 性能指标和计时
- 发生错误详细信息(如果有)
- 自定义属性和元数据
检测 OpenAI SDK
使用 OpenAI SDK 进行开发时,可以检测代码,以便将跟踪发送到 Azure AI Foundry。 按照以下步骤检测代码:
安装软件包:
pip install azure-ai-projects azure-monitor-opentelemetry opentelemetry-instrumentation-openai-v2(可选)捕获消息内容:
- PowerShell:
setx OTEL_INSTRUMENTATION_GENAI_CAPTURE_MESSAGE_CONTENT true - Bash:
export OTEL_INSTRUMENTATION_GENAI_CAPTURE_MESSAGE_CONTENT=true
- PowerShell:
获取链接 Application Insights 资源的连接字符串(“项目”>“跟踪”>“管理数据源”>“连接字符串”):
from azure.ai.projects import AIProjectClient
from azure.identity import DefaultAzureCredential

project_client = AIProjectClient(
     credential=DefaultAzureCredential(),
     endpoint="https://<your-resource>.services.ai.azure.com/api/projects/<your-project>",
)
connection_string = project_client.telemetry.get_application_insights_connection_string()
配置 Azure Monitor 并监控 OpenAI SDK:
from azure.monitor.opentelemetry import configure_azure_monitor
from opentelemetry.instrumentation.openai_v2 import OpenAIInstrumentor

configure_azure_monitor(connection_string=connection_string)
OpenAIInstrumentor().instrument()
发送请求:
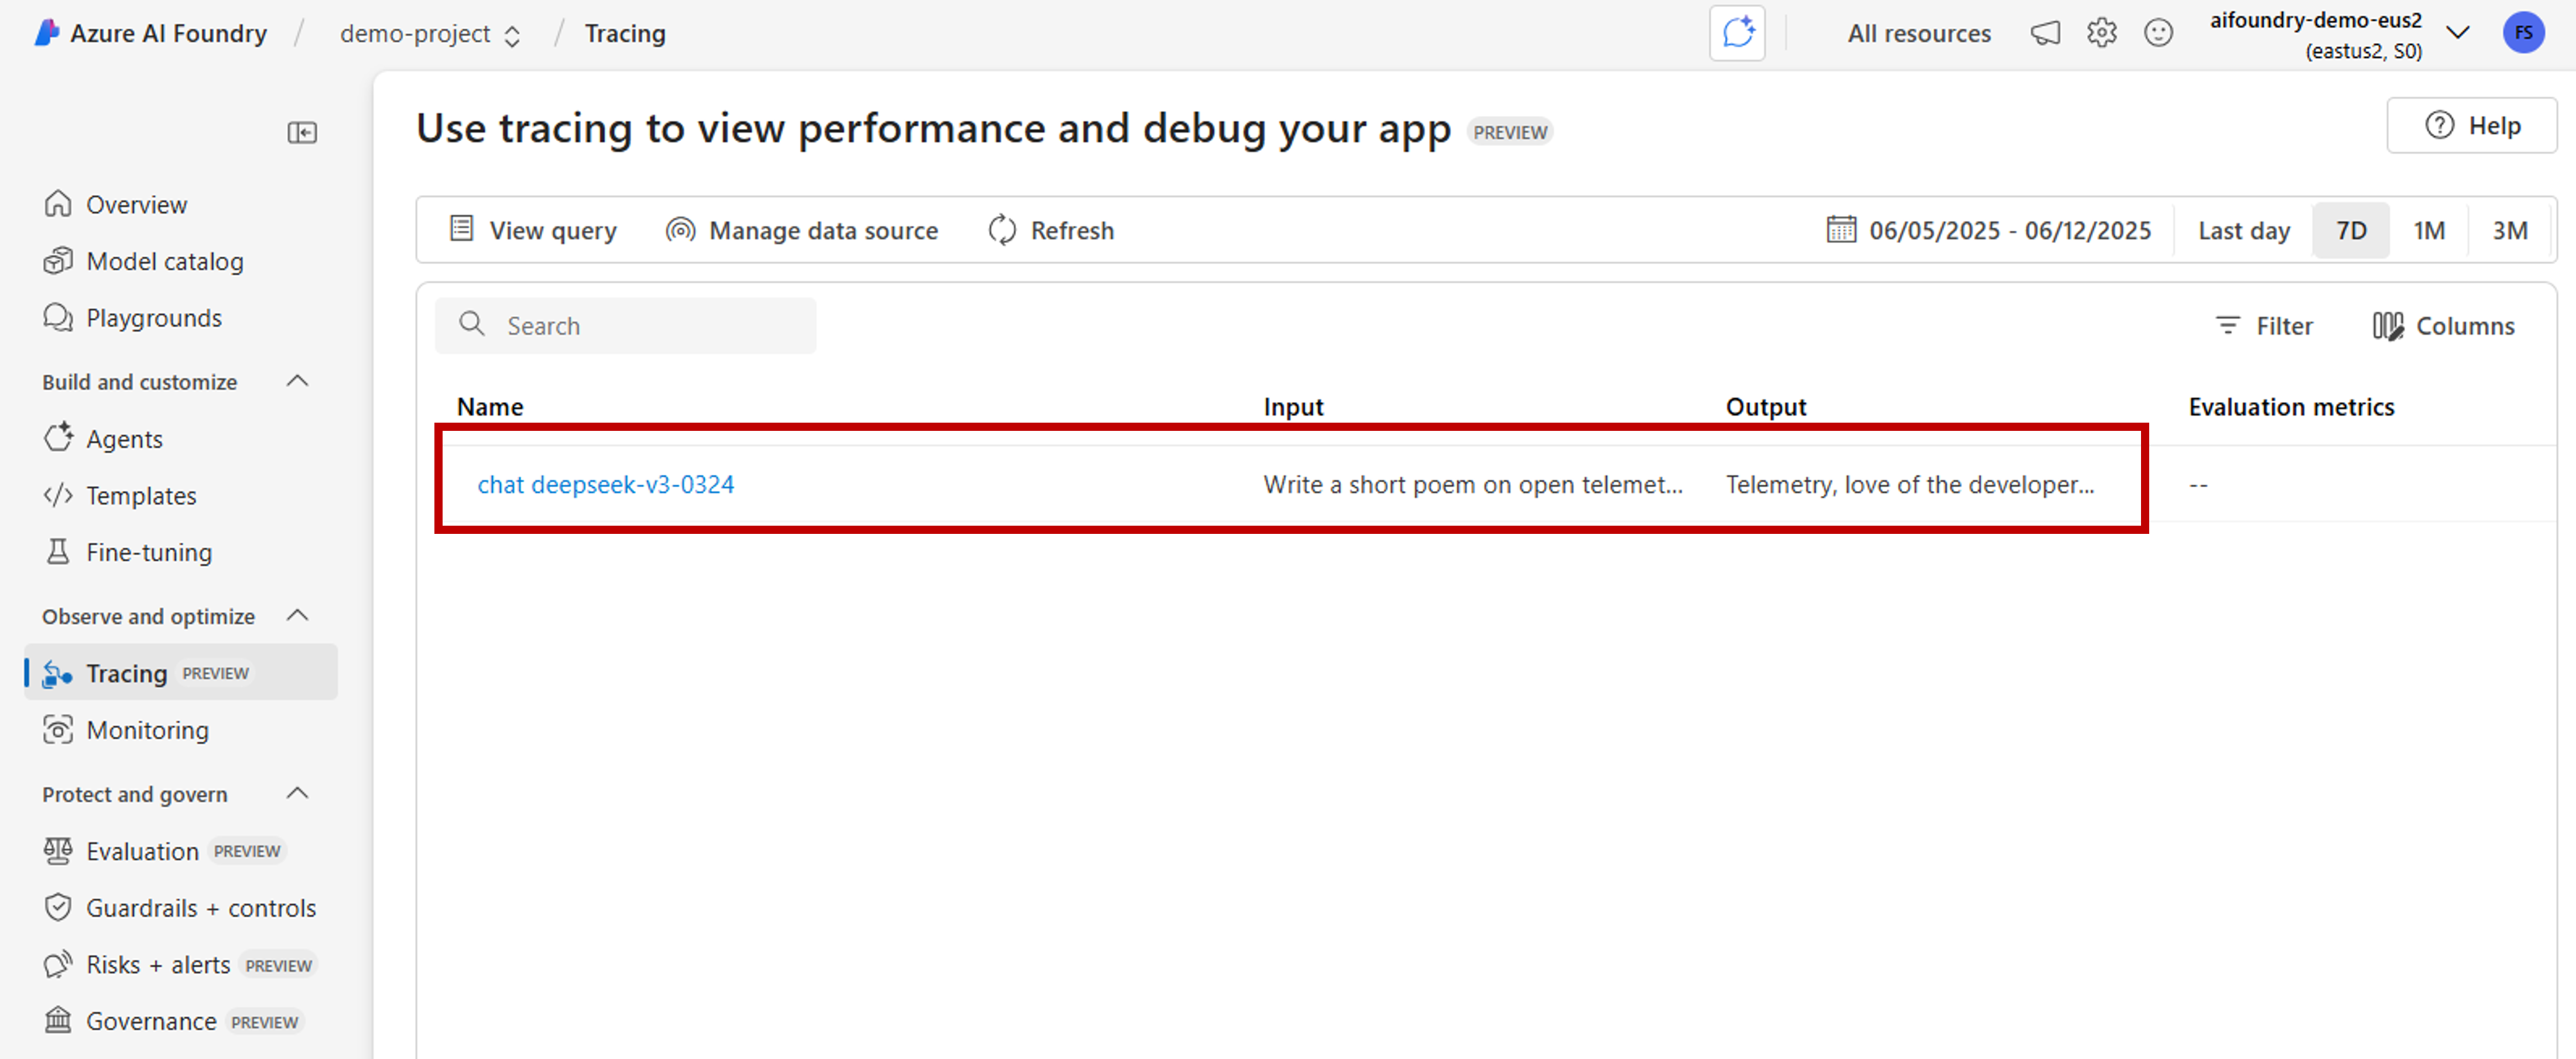
client = project_client.get_openai_client()
response = client.chat.completions.create(
     model="gpt-4o-mini",
     messages=[{"role": "user", "content": "Write a short poem on open telemetry."}],
)
print(response.choices[0].message.content)
返回到门户中的 跟踪 以查看新跟踪。
在开发复杂应用程序时,捕获将业务逻辑与模型混合的代码部分可能很有用。 OpenTelemetry 使用“跨度”的概念来捕获您感兴趣的部分。 若要开始生成自己的范围,请获取当前跟踪器对象的实例。
from opentelemetry import trace

tracer = trace.get_tracer(__name__)
然后,在你的方法中使用修饰器捕获代码中你感兴趣的特定场景。 这些修饰器自动生成范围。 下面的代码示例检测一个称为
assess_claims_with_context的方法,该方法循环访问声明列表,并使用 LLM 验证每个声明是否受上下文支持。 此方法中进行的所有调用都在同一个跨度内捕获:def build_prompt_with_context(claim: str, context: str) -> str: return [{'role': 'system', 'content': "I will ask you to assess whether a particular scientific claim, based on evidence provided. Output only the text 'True' if the claim is true, 'False' if the claim is false, or 'NEE' if there's not enough evidence."}, {'role': 'user', 'content': f""" The evidence is the following: {context} Assess the following claim on the basis of the evidence. Output only the text 'True' if the claim is true, 'False' if the claim is false, or 'NEE' if there's not enough evidence. Do not output any other text. Claim: {claim} Assessment: """}] @tracer.start_as_current_span("assess_claims_with_context") def assess_claims_with_context(claims, contexts): responses = [] for claim, context in zip(claims, contexts): response = client.chat.completions.create( model="gpt-4.1", messages=build_prompt_with_context(claim=claim, context=context), ) responses.append(response.choices[0].message.content.strip('., ')) return responses跟踪结果如下所示:
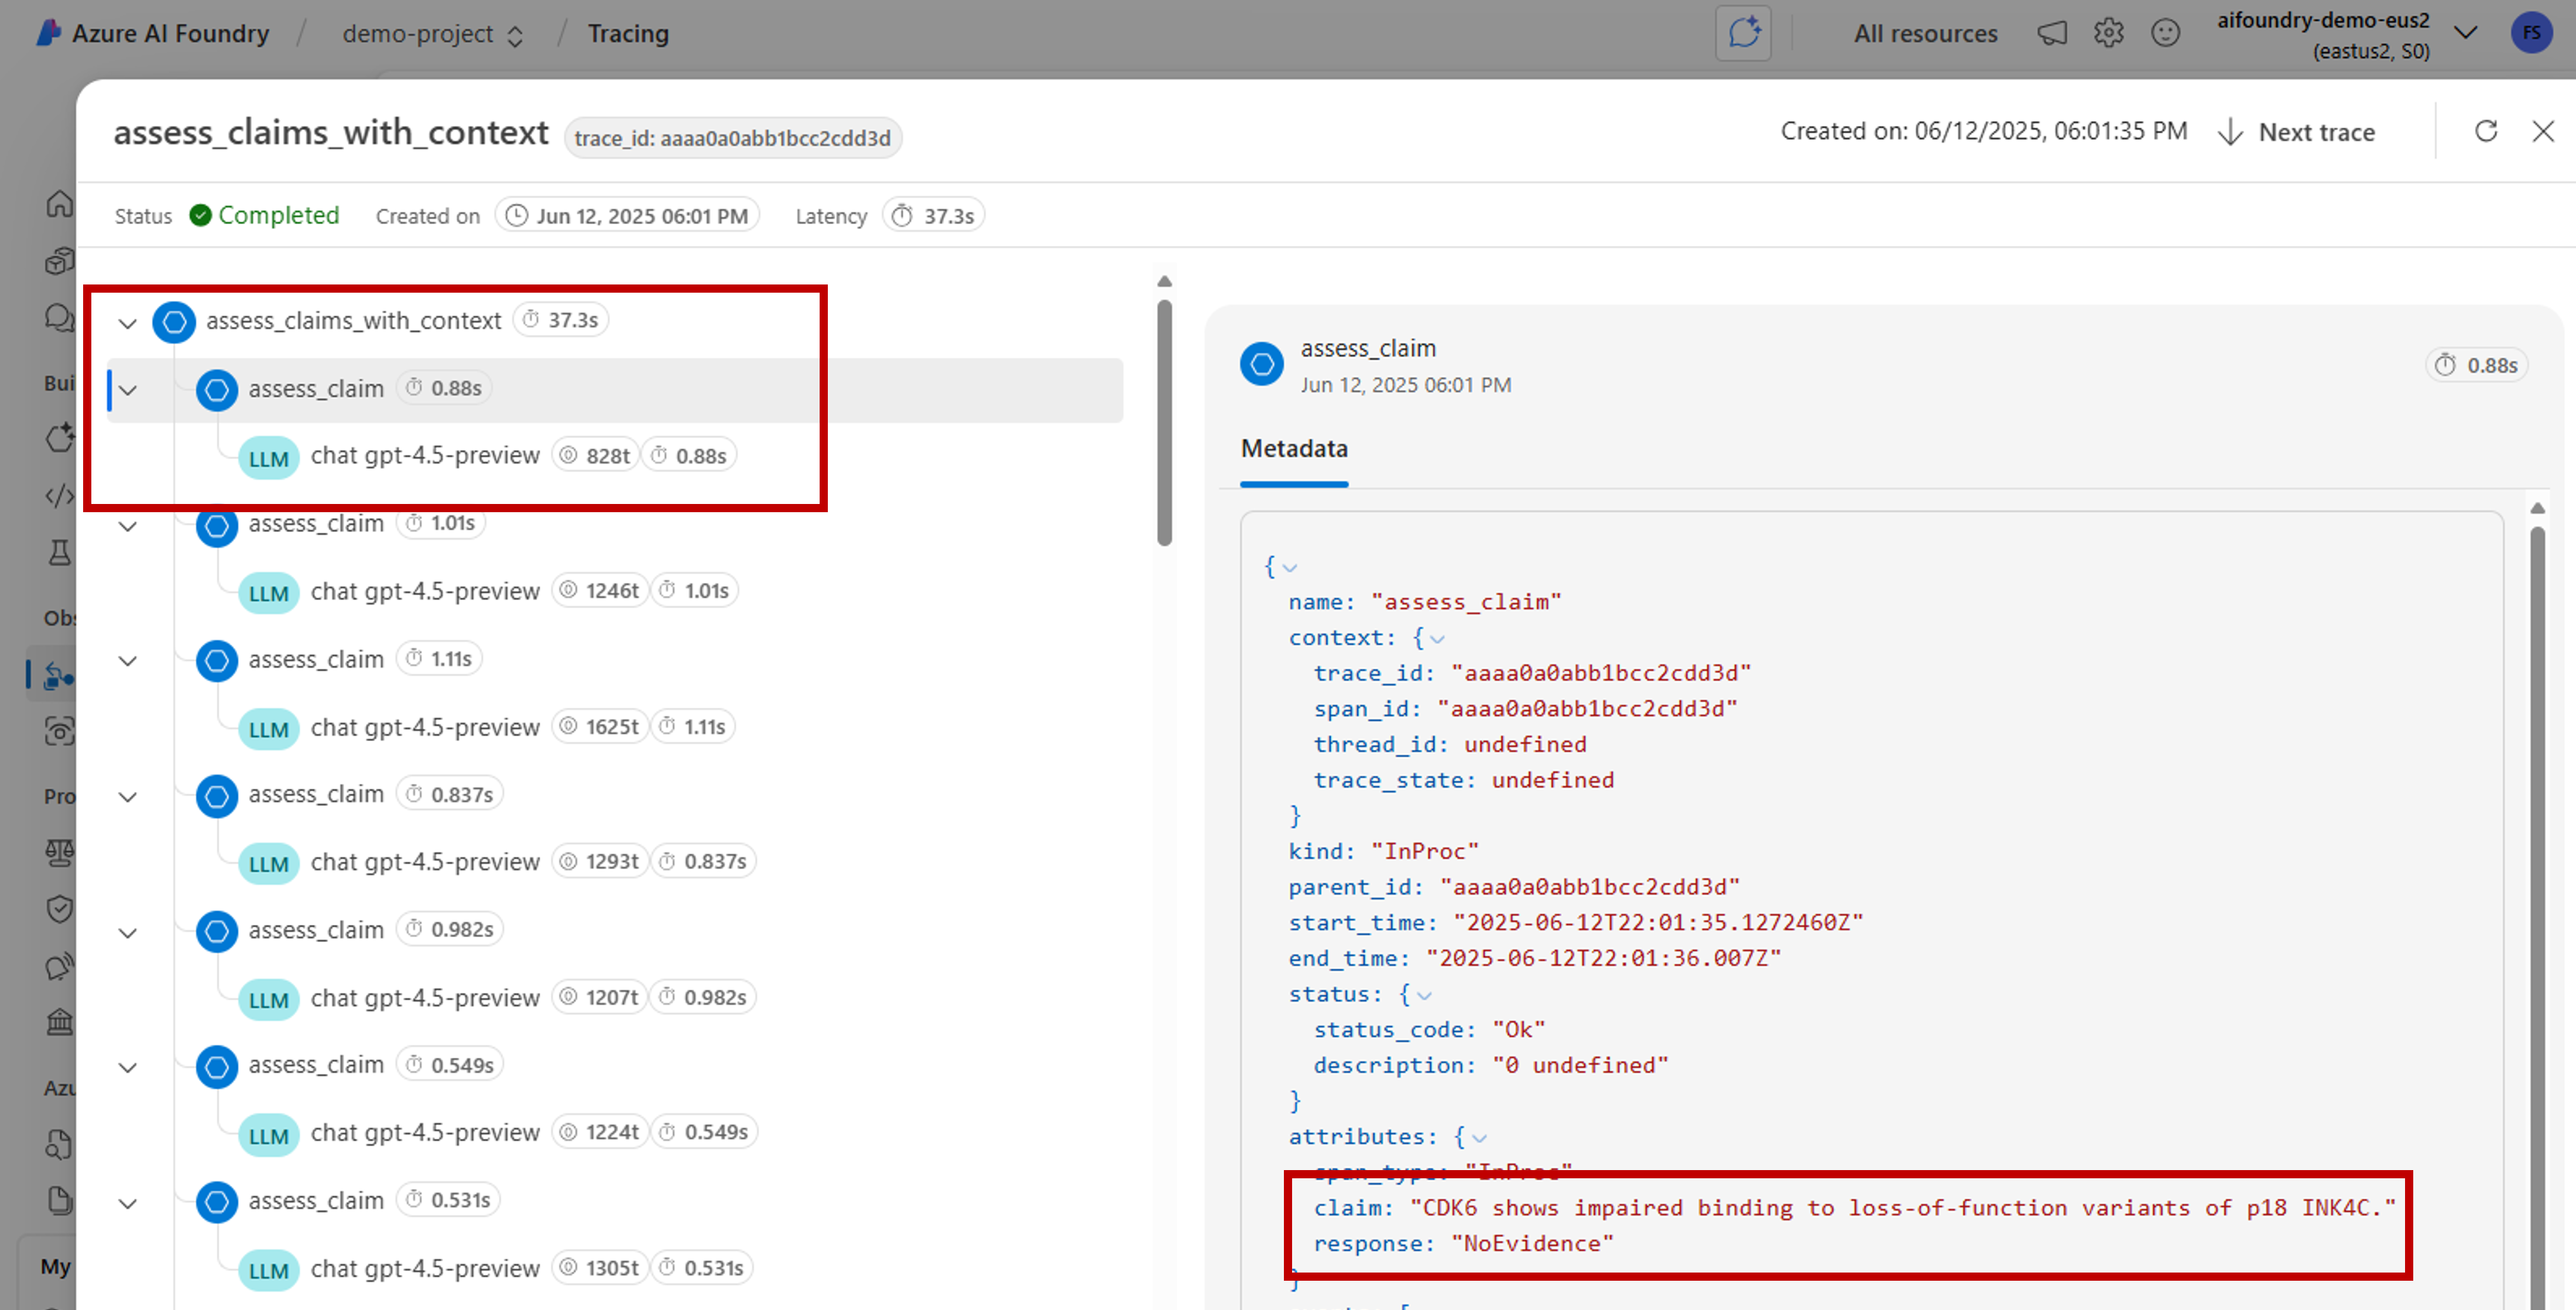
你可能还希望将额外信息添加到当前范围。 OpenTelemetry 为此使用特性的概念。 使用
trace对象来访问这些并包含额外信息。assess_claims_with_context查看该方法是如何被修改以包含一个属性的:@tracer.start_as_current_span("assess_claims_with_context") def assess_claims_with_context(claims, contexts): responses = [] current_span = trace.get_current_span() current_span.set_attribute("operation.claims_count", len(claims)) for claim, context in zip(claims, contexts): response = client.chat.completions.create( model="gpt-4.1", messages=build_prompt_with_context(claim=claim, context=context), ) responses.append(response.choices[0].message.content.strip('., ')) return responses


跟踪到控制台
此外,跟踪应用程序并将跟踪信息发送到本地执行控制台可能很有用。 使用自动化 CI/CD 管道在应用程序中运行单元测试或集成测试时,此方法可能很有用。 可以将跟踪信息发送到控制台,并通过 CI/CD 工具将其捕获,以便进一步进行分析。
按如下所示配置跟踪:
像往常一样配置 OpenAI SDK:
from opentelemetry.instrumentation.openai_v2 import OpenAIInstrumentor

OpenAIInstrumentor().instrument()
配置 OpenTelemetry 以将跟踪发送到控制台:
from opentelemetry import trace
from opentelemetry.sdk.trace import TracerProvider
from opentelemetry.sdk.trace.export import SimpleSpanProcessor, ConsoleSpanExporter

span_exporter = ConsoleSpanExporter()
tracer_provider = TracerProvider()
tracer_provider.add_span_processor(SimpleSpanProcessor(span_exporter))
trace.set_tracer_provider(tracer_provider)
像往常一样使用 OpenAI SDK:
response = client.chat.completions.create(
    model="deepseek-v3-0324",
    messages=[
        {"role": "user", "content": "Write a short poem on open telemetry."},
    ],
)
{ "name": "chat deepseek-v3-0324", "context": { "trace_id": "0xaaaa0a0abb1bcc2cdd3d", "span_id": "0xaaaa0a0abb1bcc2cdd3d", "trace_state": "[]" }, "kind": "SpanKind.CLIENT", "parent_id": null, "start_time": "2025-06-13T00:02:04.271337Z", "end_time": "2025-06-13T00:02:06.537220Z", "status": { "status_code": "UNSET" }, "attributes": { "gen_ai.operation.name": "chat", "gen_ai.system": "openai", "gen_ai.request.model": "deepseek-v3-0324", "server.address": "my-project.services.ai.azure.com", "gen_ai.response.model": "DeepSeek-V3-0324", "gen_ai.response.finish_reasons": [ "stop" ], "gen_ai.response.id": "aaaa0a0abb1bcc2cdd3d", "gen_ai.usage.input_tokens": 14, "gen_ai.usage.output_tokens": 91 }, "events": [], "links": [], "resource": { "attributes": { "telemetry.sdk.language": "python", "telemetry.sdk.name": "opentelemetry", "telemetry.sdk.version": "1.31.1", "service.name": "unknown_service" }, "schema_url": "" } }
在本地使用 AI 工具包进行跟踪
AI 工具包提供了一种在 VS Code 中本地跟踪的简单方法。 它使用本地 OTLP 兼容的收集器,使其非常适合开发和调试,而无需云访问。
该工具包通过 OpenTelemetry 支持 OpenAI SDK 和其他 AI 框架。 您可以在开发环境中立即查看跟踪。
有关详细的设置说明和特定于 SDK 的代码示例,请参阅 AI 工具包中的跟踪。