Note
Access to this page requires authorization. You can try signing in or changing directories.
Access to this page requires authorization. You can try changing directories.
This article provides troubleshooting guidance for issues in which a Microsoft SQL Server query takes an excessive amount of time to end (hours or days).
Symptoms
This article focuses on queries that seem to run or compile without end. That is, their CPU usage continues to increase. This article doesn't apply to queries that are blocked or waiting on a resource that's never released. In those cases, the CPU usage remains constant or changes only slightly.
Important
If a query is left to continue running, it might eventually finish. This process could take just a few seconds or several days. In some situations, the query might really be endless, for example when a WHILE loop doesn't exit. The term "never-ending" is used here to describe the perception of a query that doesn't finish.
Cause
Common causes of long-running (never-ending) queries include:
- Nested Loop (NL) joins on very large tables: Because of the nature of NL joins, a query that joins tables that have lots of rows might run for a long time. For more information, see Joins.
- One example of an NL join is the use of
TOP,FAST, orEXISTS. Even if a Hash or Merge join might be faster, the optimizer can't use either operator because of the row goal. - Another example of an NL join is the use of an inequality join predicate in a query. For example,
SELECT .. FROM tab1 AS a JOIN tab 2 AS b ON a.id > b.id. The optimizer can't use a Merge or Hash joins here either.
- One example of an NL join is the use of
- Out-of-date statistics: Queries that pick a plan based on outdated statistics might be suboptimal and take a long time to run.
- Endless loops: T-SQL queries that use WHILE loops might be incorrectly written. The resulting code never leaves the loop and runs endlessly. These queries are truly never-ending. They run until they're killed manually.
- Complex queries that have many joins and large tables: Queries that involve many joined tables would typically have complex query plans that might take a long time to run. This scenario is common in analytical queries that don't filter out rows and that involve a large number of tables.
- Missing indexes: Queries can run significantly faster if appropriate indexes are used on tables. Indexes enable the selection of a subset of the data to provide faster access.
Solution
Step 1: Discover never-ending queries
Look for a never-ending query that's running on the system. You have to determine whether a query has a long execution time, a long wait time (stuck on a bottleneck), or a long compilation time.
1.1 Run a diagnostic
Run the following diagnostic query on your SQL Server instance where the never-ending query is active:
DECLARE @cntr INT = 0

WHILE (@cntr < 3)
BEGIN
    SELECT TOP 10 s.session_id,
                    r.status,
                    CAST(r.cpu_time / (1000 * 60.0) AS DECIMAL(10,2)) AS cpu_time_minutes,
                    CAST(r.total_elapsed_time / (1000 * 60.0) AS DECIMAL(10,2)) AS elapsed_minutes,
                    r.logical_reads,
                    r.wait_time,
                    r.wait_type,
                    r.wait_resource,
                    r.reads,
                    r.writes,
                    SUBSTRING(st.TEXT, (r.statement_start_offset / 2) + 1,
                    ((CASE r.statement_end_offset
                        WHEN -1 THEN DATALENGTH(st.TEXT)
                        ELSE r.statement_end_offset
                    END - r.statement_start_offset) / 2) + 1) AS statement_text,
                    COALESCE(QUOTENAME(DB_NAME(st.dbid)) + N'.' + QUOTENAME(OBJECT_SCHEMA_NAME(st.objectid, st.dbid))
                    + N'.' + QUOTENAME(OBJECT_NAME(st.objectid, st.dbid)), '') AS command_text,
                    r.command,
                    s.login_name,
                    s.host_name,
                    s.program_name,
                    s.last_request_end_time,
                    s.login_time,
                    r.open_transaction_count,
                    atrn.name as transaction_name,
                    atrn.transaction_id,
                    atrn.transaction_state
        FROM sys.dm_exec_sessions AS s
        JOIN sys.dm_exec_requests AS r ON r.session_id = s.session_id
                CROSS APPLY sys.Dm_exec_sql_text(r.sql_handle) AS st
        LEFT JOIN (sys.dm_tran_session_transactions AS stran
                JOIN sys.dm_tran_active_transactions AS atrn
                ON stran.transaction_id = atrn.transaction_id)
        ON stran.session_id =s.session_id
        WHERE r.session_id != @@SPID
        ORDER BY r.cpu_time DESC

    SET @cntr = @cntr + 1
WAITFOR DELAY '00:00:05'
END
1.2 Examine the output
There are several scenarios that can cause a query to run for a long time: long execution, long wait, and long compilation. For more information about why a query might run slowly, see Running vs. Waiting: why are queries slow?
Long execution time
The troubleshooting steps in this article are applicable when you receive an output similar to the following, where the CPU time is increasing proportionately to the elapsed time without significant wait times.
| session_id | status | cpu_time_minutes | elapsed_time_minutes | logical_reads | wait_time_minutes | wait_type |
|---|---|---|---|---|---|---|
| 56 | running | 64.40 | 23.50 | 0 | 0.00 | NULL |
The query is continuously running if it has:
- An increasing CPU time
- A status of
runningorrunnable - Minimal or zero wait time
- No wait_type
In this situation, the query is reading rows, joining, processing results, calculating, or formatting. These activities are all CPU-bound actions.
Note
Changes in logical_reads aren't relevant in this case because some CPU-bound T-SQL requests, such as performing computations or a WHILE loop, might not do any logical reads at all.
If the slow query meets these criteria, focus on reducing its runtime. Typically, reducing runtime involves reducing the number of rows that the query has to process throughout its life by applying indexes, rewriting the query, or updating statistics. For more information, see the Resolution section.
Long wait time
This article isn't applicable to long wait scenarios. In a wait scenario, you might receive an output that resembles the following example in which the CPU usage doesn't change or changes slightly because the session is waiting on a resource:
| session_id | status | cpu_time_minutes | elapsed_time_minutes | logical_reads | wait_time_minutes | wait_type |
|---|---|---|---|---|---|---|
| 56 | suspended | 0.03 | 4.20 | 50 | 4.10 | LCK_M_U |
The wait type indicates that the session is waiting on a resource. A long elapsed time and a long wait time indicate that the session is waiting for most its life for this resource. Тhe short CPU time indicates that little time was spent actually processing the query.
To troubleshoot queries that are long because of waits, see Troubleshoot slow-running queries in SQL Server.
Long compilation time
On rare occasions, you might observe that the CPU usage increases continuously over time but isn't driven by the query execution. Instead, an excessively long compilation (the parsing and compiling of a query) might be the cause. In these cases, check the transaction_name output column for a value of sqlsource_transform. This transaction name indicates a compilation.
Step 2: Collect diagnostic logs manually
After you determine that a never-ending query exists on the system, you can collect the query's plan data to troubleshoot further. To collect the data, use one of the following methods, depending on your version of SQL Server.
- SQL Server 2008 - SQL Server 2014 (earlier than SP2)
- SQL Server 2014 (later than SP2) and SQL Server 2016 (earlier than SP1)
- SQL Server 2016 (later than SP1) and SQL Server 2017
- SQL Server 2019 and later versions
To collect diagnostic data by using SQL Server Management Studio (SSMS), follow these steps:
Capture the estimated query execution plan XML.
Review the query plan to learn whether the data shows obvious indications of what's causing the slowness. Examples of typical indications include:
- Table or index scans (look at estimated rows)
- Nested loops driven by a huge outer table data set
- Nested loops that have a large branch in the inner side of the loop
- Table spools
- Functions in the
SELECTlist that take a long time to process each row
If the query runs quicker at any time, you can capture the "fast" runs (actual XML execution plan) to compare results.
Use SQL LogScout to capture never-ending queries
You can use SQL LogScout to capture logs while a never-ending query is running. Use the never ending query scenario with the following command:
.\SQL_LogScout.ps1 -Scenario "NeverEndingQuery" -ServerName "SQLInstance"
Note
This log capture process requires the long query to consume at least 60 seconds of CPU time.
SQL LogScout captures at least three query plans for each high-CPU-consuming query. You can find file names that resemble servername_datetime_NeverEnding_statistics_QueryPlansXml_Startup_sessionId_#.sqlplan. You can use these files in the next step when you review plans to identify the reason for long query execution.
Step 3: Review the collected plans
This section discusses how to review the collected data. It uses the multiple XML query plans (using extension .sqlplan) that are collected in Microsoft SQL Server 2016 SP1 and later builds and versions.
Compare execution plans by following these steps:
Open a previously saved query execution plan file (
.sqlplan).Right-click in a blank area of the execution plan, and select Compare Showplan.
Choose the second query plan file that you would like to compare.
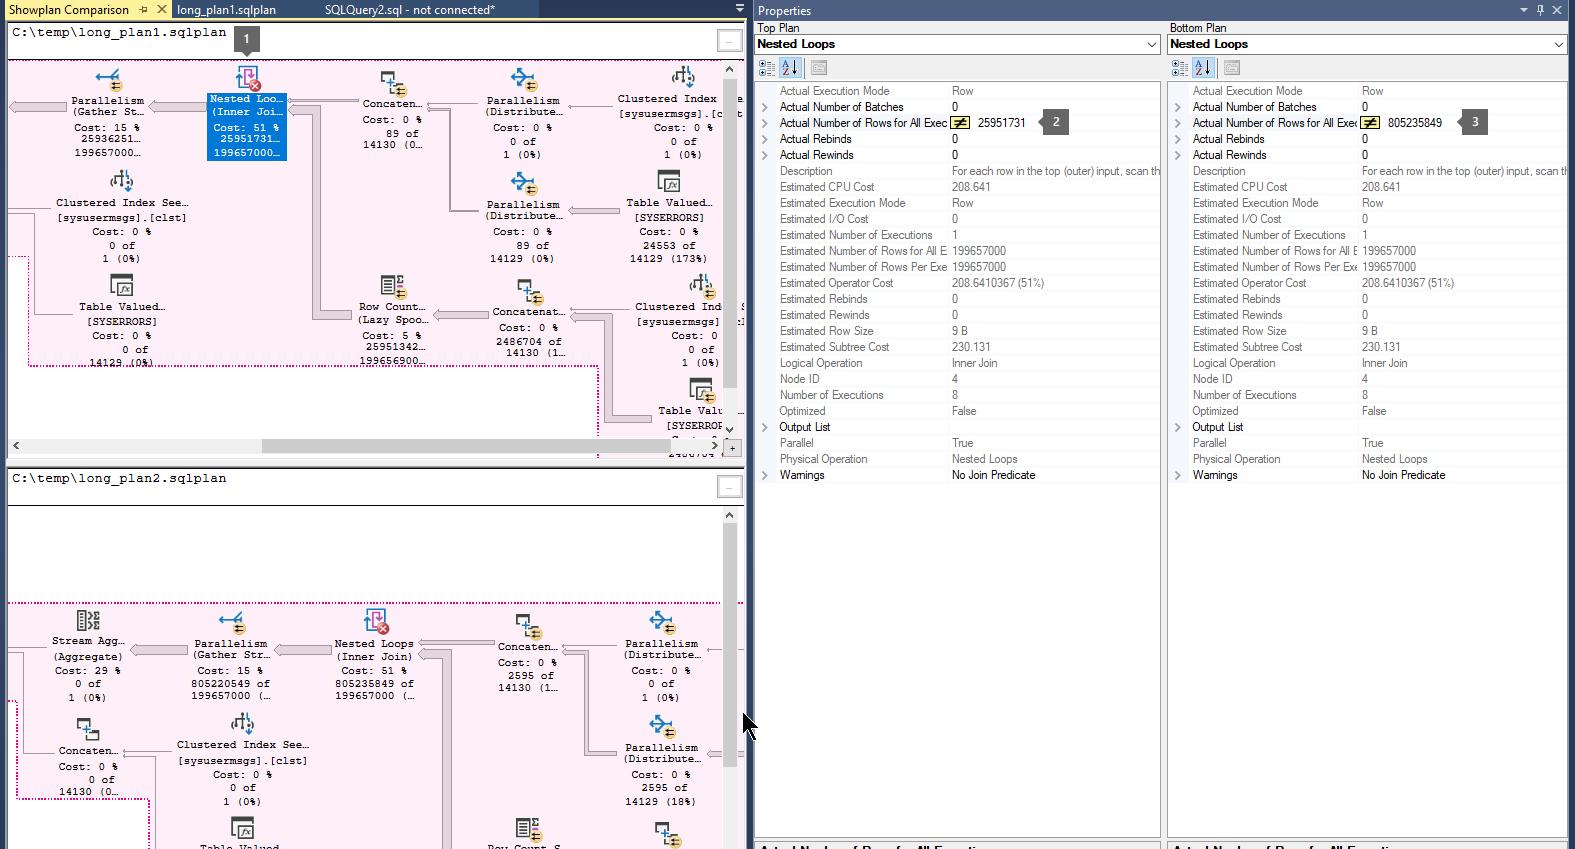
Look for thick arrows that indicate a large number of rows flowing between operators. Then, select the operator before or after the arrow, and compare the number of actual rows across the two plans.
Compare the second and third plans to learn whether the largest flow of rows occurs in the same operators.
For example:

Step 4: Resolution
Make sure that statistics are updated for the tables that are used in the query.
Look for missing index recommendations in the query plan, and apply any that you find.
Simplify the query:
- Use more selective
WHEREpredicates to reduce the data that's processed up-front. - Break it apart.
- Select some parts into temp tables, and join them later.
- Remove
TOP,EXISTS, andFAST(T-SQL) in the queries that run for a long time because of an optimizer row goal.- Alternatively, use the
DISABLE_OPTIMIZER_ROWGOALhint. For more information, see Row Goals Gone Rogue.
- Alternatively, use the
- Avoid using Common Table Expressions (CTEs) in such cases because they combine statements into a single large query.
- Use more selective
Try using query hints to produce a better plan:
HASH JOINorMERGE JOINhintFORCE ORDERhintFORCESEEKhintRECOMPILE- USE
PLAN N'<xml_plan>'(if you have a fast query plan that you can force)
Use Query Store (QDS) to force a good known plan if such a plan exists and if your SQL Server version supports Query Store.