This article offers general recommendations and specific suggestions to troubleshoot issues with application monitoring in Azure App Service.
Note
Some troubleshooting steps on this page are only applicable to certain languages or frameworks, as indicated by the available tabs.
Missing telemetry
Note
When you create a web app with the ASP.NET runtimes in App Service, it deploys a single static HTML page as a starter website. We do not recommend that you troubleshoot an issue with a default template. Deploy an application before you troubleshoot an issue.
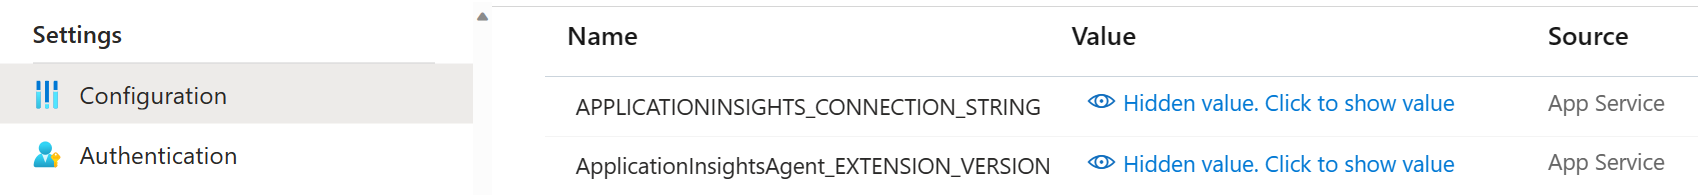
Check that the ApplicationInsightsAgent_EXTENSION_VERSION app setting is set to a value of ~2.
Browse to https://yoursitename.scm.azurewebsites.net/ApplicationInsights.
 lightbox="media/troubleshoot-app-service/app-insights-sdk-status.png"::
Confirm that Application Insights Extension Status is Pre-Installed Site Extension, version 2.8.x.xxxx and is running.
If it isn't running, follow the instructions to enable Application Insights monitoring.
Confirm that the status source exists and looks like Status source D:\home\LogFiles\ApplicationInsights\status\status_RD0003FF0317B6_4248_1.json.
If a similar value isn't present, it means the application isn't currently running or isn't supported. To ensure that the application is running, try manually visiting the application URL/application endpoints, which allows the runtime information to become available.
Confirm that IKeyExists is true.
If not, add APPINSIGHTS_INSTRUMENTATIONKEY and APPLICATIONINSIGHTS_CONNECTION_STRING with your instrumentation key GUID to your application settings.
Confirm that there are no entries for AppAlreadyInstrumented, AppContainsDiagnosticSourceAssembly, and AppContainsAspNetTelemetryCorrelationAssembly.
If any of these entries exist, remove the following packages from your application: Microsoft.ApplicationInsights, System.Diagnostics.DiagnosticSource, and Microsoft.AspNet.TelemetryCorrelation.
Note
When you create a web app with the ASP.NET Core runtimes in App Service, it deploys a single static HTML page as a starter website. We do not recommend that you troubleshoot an issue with the default template. Deploy an application before you troubleshoot an issue.
Windows
Check that the ApplicationInsightsAgent_EXTENSION_VERSION app setting is set to a value of ~2.
Browse to https://yoursitename.scm.azurewebsites.net/ApplicationInsights.
Confirm that Application Insights Extension Status is Pre-Installed Site Extension, version 2.8.x.xxxx, is running.
If it isn't running, follow the instructions in the section Enable Application Insights monitoring.
Confirm that the status source exists and looks like Status source D:\home\LogFiles\ApplicationInsights\status\status_RD0003FF0317B6_4248_1.json.
If a similar value isn't present, it means the application isn't currently running or isn't supported. To ensure that the application is running, try manually visiting the application URL/application endpoints, which allows the runtime information to become available.
Confirm that IKeyExists is True. If it's False, add APPINSIGHTS_INSTRUMENTATIONKEY and APPLICATIONINSIGHTS_CONNECTION_STRING with your ikey GUID to your application settings.
If your application refers to any Application Insights packages, enabling the App Service integration might not take effect, and the data might not appear in Application Insights. An example would be if you previously instrumented, or attempted to instrument, your app with the ASP.NET Core SDK. To fix the issue, in the Azure portal, turn on Interop with Application Insights SDK.
Important
This functionality is in preview.

The data is sent using a codeless approach, even if the Application Insights SDK was originally used or attempted to be used.
Important
If the application used the Application Insights SDK to send any telemetry, the telemetry will be disabled. In other words, custom telemetry (for example, any Track*() methods) and custom settings (such as sampling) will be disabled.
Linux
Check that the ApplicationInsightsAgent_EXTENSION_VERSION app setting is set to a value of ~3.
Browse to https://your site name.scm.azurewebsites.net/ApplicationInsights.
Within this site, confirm:
- The status source exists and looks like
Status source /var/log/applicationinsights/status_abcde1234567_89_0.json.
- The value
Auto-Instrumentation enabled successfully is displayed. If a similar value isn't present, it means the application isn't running or isn't supported. To ensure that the application is running, try manually visiting the application URL/application endpoints, which allows the runtime information to become available.
- IKeyExists is
True. If it's False, add APPINSIGHTS_INSTRUMENTATIONKEY and APPLICATIONINSIGHTS_CONNECTION_STRING with your ikey GUID to your application settings.

Check that ApplicationInsightsAgent_EXTENSION_VERSION app setting is set to a value of ~2 on Windows, ~3 on Linux
Examine the log file to see that the agent started successfully: browse to https://yoursitename.scm.azurewebsites.net/, under SSH change to the root directory, the log file is located under LogFiles/ApplicationInsights.

After enabling application monitoring for your Java app, you can validate that the agent is working by looking at the live metrics - even before you deploy and app to App Service you'll see some requests from the environment. Remember that the full set of telemetry is only available when you have your app deployed and running.
Set APPLICATIONINSIGHTS_SELF_DIAGNOSTICS_LEVEL environment variable to debug if you don't see any errors and there's no telemetry.
Windows
Check that ApplicationInsightsAgent_EXTENSION_VERSION app setting is set to a value of ~2.
Browse to https://yoursitename.scm.azurewebsites.net/ApplicationInsights.
Confirm that the Application Insights Extension Status is Pre-Installed Site Extension, version 2.8.x.xxxx, is running.
If it isn't running, follow the enable Application Insights monitoring instructions.
Navigate to D:\local\Temp\status.json and open status.json.
Confirm that SDKPresent is set to false, AgentInitializedSuccessfully to true and IKey to have a valid iKey.
Example of the JSON file:
    "AppType":"node.js",

    "MachineName":"c89d3a6d0357",

    "PID":"47",

    "AgentInitializedSuccessfully":true,

    "SDKPresent":false,

    "IKey":"00000000-0000-0000-0000-000000000000",

    "SdkVersion":"1.8.10"
If SDKPresent is true, it means the extension detected that some aspect of the SDK is already present in the Application, and will back-off.
Linux
Check that ApplicationInsightsAgent_EXTENSION_VERSION app setting is set to a value of ~3.
Navigate to /var/log/applicationinsights/ and open status.json.
Confirm that SDKPresent is set to false, AgentInitializedSuccessfully to true and IKey to have a valid iKey.
Example of the JSON file:
    "AppType":"node.js",

    "MachineName":"c89d3a6d0357",

    "PID":"47",

    "AgentInitializedSuccessfully":true,

    "SDKPresent":false,

    "IKey":"00000000-0000-0000-0000-000000000000",

    "SdkVersion":"1.8.10"
If SDKPresent is true, it means the extension detected that some aspect of the SDK is already present in the Application, and will back-off.
If you're missing telemetry, follow these steps to confirm that autoinstrumentation is enabled correctly.
Confirm that autoinstrumentation is enabled in the Application Insights experience on your App Service resource.

Confirm that the ApplicationInsightsAgent_EXTENSION_VERSION app setting is set to a value of ~3 and that your APPLICATIONINSIGHTS_CONNECTION_STRING points to the appropriate Application Insights resource.
Check autoinstrumentation diagnostics and status logs.
a. Navigate to /var/log/applicationinsights/ and open status_*.json.
b. Confirm that AgentInitializedSuccessfully is set to true and IKey to have a valid iKey.
Example JSON file:
    "AgentInitializedSuccessfully":true,

    "AppType":"python",

    "MachineName":"c89d3a6d0357",

    "PID":"47",

    "IKey":"00000000-0000-0000-0000-000000000000",

    "SdkVersion":"1.0.0"
The applicationinsights-extension.log file in the same folder may show other helpful diagnostics.
Default website deployed with web apps doesn't support automatic client-side monitoring
When you create a web app with the ASP.NET runtimes in App Service, it deploys a single static HTML page as a starter website. The static webpage also loads an ASP.NET-managed web part in IIS. This page allows for testing codeless server-side monitoring but doesn't support automatic client-side monitoring.
If you want to test out codeless server and client-side monitoring for ASP.NET in an App Service web app, we recommend following the official guides for creating an ASP.NET Framework web app. Afterwards, use the instructions in the current article to enable monitoring.
When you create a web app with the ASP.NET Core runtimes in App Service, it deploys a single static HTML page as a starter website. The static webpage also loads an ASP.NET-managed web part in IIS. This behavior allows for testing codeless server-side monitoring but doesn't support automatic client-side monitoring.
If you want to test out codeless server and client-side monitoring for ASP.NET Core in an App Service web app, we recommend following the official guides for creating an ASP.NET Core web app. Afterwards, use the instructions in the current article to enable monitoring.
APPINSIGHTS_JAVASCRIPT_ENABLED and urlCompression not supported
If you use APPINSIGHTS_JAVASCRIPT_ENABLED=true in cases where content is encoded, you might get errors like:
- 500 URL rewrite error.
- 500.53 URL rewrite module error with the message "Outbound rewrite rules can't be applied when the content of the HTTP response is encoded ('gzip')."
An error occurs because the APPINSIGHTS_JAVASCRIPT_ENABLED application setting is set to true and content encoding is present at the same time. This scenario isn't supported yet. The workaround is to remove APPINSIGHTS_JAVASCRIPT_ENABLED from your application settings. Unfortunately, if client/browser-side JavaScript instrumentation is still required, manual SDK references are needed for your webpages. Follow the instructions for manual instrumentation with the JavaScript SDK.
For the latest information on the Application Insights agent/extension, see the release notes.
PHP and WordPress sites aren't supported. There's currently no officially supported SDK/agent for server-side monitoring of these workloads. To track client-side transactions on a PHP or WordPress site, add the client-side JavaScript to your webpages using the JavaScript SDK.
The following table provides an explanation of what these values mean, their underlying causes, and recommended fixes.
| Problem value |
Explanation |
Fix |
AppAlreadyInstrumented:true |
This value indicates that the extension detected some aspect of the SDK already present in the application and backs off. A reference to Microsoft.ApplicationInsights.AspNetCore or Microsoft.ApplicationInsights can cause this value. |
Remove the references. Some of these references are added by default from certain Visual Studio templates. Older versions of Visual Studio reference Microsoft.ApplicationInsights. |
AppAlreadyInstrumented:true |
The presence of Microsoft.ApplicationsInsights DLL in the app folder from a previous deployment can also cause this value. |
Clean the app folder to ensure that these DLLs are removed. Check both your local app's bin directory and the wwwroot directory on the App Service. (To check the wwwroot directory of your App Service web app, select Advanced Tools (Kudu) > Debug console > CMD > home\site\wwwroot). |
IKeyExists:false |
This value indicates that the instrumentation key isn't present in the app setting APPINSIGHTS_INSTRUMENTATIONKEY. Possible causes include accidentally removing the values or forgetting to set the values in automation script. |
Make sure the setting is present in the App Service application settings. |
PHP and WordPress aren't supported
PHP and WordPress sites aren't supported. There's currently no officially supported SDK/agent for server-side monitoring of these workloads. To track client-side transactions on a PHP or WordPress site, add the client-side JavaScript to your webpages using the JavaScript SDK.
The following table provides an explanation of what these values mean, their underlying causes, and recommended fixes.
| Problem value |
Explanation |
Fix |
AppAlreadyInstrumented:true |
This value indicates that the extension detected some aspect of the SDK already present in the application and backs off. A reference to System.Diagnostics.DiagnosticSource, Microsoft.AspNet.TelemetryCorrelation, or Microsoft.ApplicationInsights can cause this value. |
Remove the references. Some of these references are added by default from certain Visual Studio templates. Older versions of Visual Studio might add references to Microsoft.ApplicationInsights. |
AppAlreadyInstrumented:true |
The presence of the preceding DLLs in the app folder from a previous deployment can also cause this value. |
Clean the app folder to ensure that these DLLs are removed. Check both your local app's bin directory and the wwwroot directory on the App Service resource. To check the wwwroot directory of your App Service web app, select Advanced Tools (Kudu) > Debug console > CMD > home\site\wwwroot. |
AppContainsAspNetTelemetryCorrelationAssembly: true |
This value indicates that the extension detected references to Microsoft.AspNet.TelemetryCorrelation in the application and backs off. |
Remove the reference. |
AppContainsDiagnosticSourceAssembly**:true |
This value indicates that the extension detected references to System.Diagnostics.DiagnosticSource in the application and backs off. |
For ASP.NET, remove the reference. |
IKeyExists:false |
This value indicates that the instrumentation key isn't present in the app setting APPINSIGHTS_INSTRUMENTATIONKEY. Possible causes might be that the values were accidentally removed, or you forgot to set the values in the automation script. |
Make sure the setting is present in the App Service application settings. |
PHP and WordPress sites aren't supported. There's currently no officially supported SDK/agent for server-side monitoring of these workloads. To track client-side transactions on a PHP or WordPress site, add the client-side JavaScript to your webpages using the JavaScript SDK.
The following table provides an explanation of what these values mean, their underlying causes, and recommended fixes.
| Problem value |
Explanation |
Fix |
AppAlreadyInstrumented:true |
This value indicates that the extension detected some aspect of the SDK already present in the application and backs off. A reference to Microsoft.ApplicationInsights.AspNetCore or Microsoft.ApplicationInsights can cause this value. |
Remove the references. Some of these references are added by default from certain Visual Studio templates. Older versions of Visual Studio reference Microsoft.ApplicationInsights. |
AppAlreadyInstrumented:true |
The presence of Microsoft.ApplicationsInsights DLL in the app folder from a previous deployment can also cause this value. |
Clean the app folder to ensure that these DLLs are removed. Check both your local app's bin directory and the wwwroot directory on the App Service. (To check the wwwroot directory of your App Service web app, select Advanced Tools (Kudu) > Debug console > CMD > home\site\wwwroot). |
IKeyExists:false |
This value indicates that the instrumentation key isn't present in the app setting APPINSIGHTS_INSTRUMENTATIONKEY. Possible causes include accidentally removing the values or forgetting to set the values in automation script. |
Make sure the setting is present in the App Service application settings. |
System.IO.FileNotFoundException after 2.8.44 upgrade
The 2.8.44 version of autoinstrumentation upgrades Application Insights SDK to 2.20.0. The Application Insights SDK has an indirect reference to System.Runtime.CompilerServices.Unsafe.dll through System.Diagnostics.DiagnosticSource.dll. If the application has binding redirect for System.Runtime.CompilerServices.Unsafe.dll and if this library isn't present in the application folder, it might throw System.IO.FileNotFoundException.
To resolve this issue, remove the binding redirect entry for System.Runtime.CompilerServices.Unsafe.dll from the web.config file. If the application wanted to use System.Runtime.CompilerServices.Unsafe.dll, set the binding redirect as shown here:
<dependentAssembly>
    <assemblyIdentity name="System.Runtime.CompilerServices.Unsafe" publicKeyToken="b03f5f7f11d50a3a" culture="neutral" />
    <bindingRedirect oldVersion="0.0.0.0-4.0.4.1" newVersion="4.0.4.1" />
</dependentAssembly>
As a temporary workaround, you could set the app setting ApplicationInsightsAgent_EXTENSION_VERSION to a value of 2.8.37. This setting triggers App Service to use the old Application Insights extension. Temporary mitigations should only be used as an interim.
Duplicate telemetry
Only use autoinstrumentation on App Service if you aren't using manual instrumentation of OpenTelemetry in your code, such as the Azure Monitor OpenTelemetry Distro or the Azure Monitor OpenTelemetry Exporter.
Using autoinstrumentation on top of the manual instrumentation could cause duplicate telemetry and increase your cost. In order to use App Service OpenTelemetry autoinstrumentation, first remove manual instrumentation of OpenTelemetry from your code.
If you're seeing unexpected charges or high costs in Application Insights, this guide can help. It covers common causes like high telemetry volume, data ingestion spikes, and misconfigured sampling. It's especially useful if you're troubleshooting issues related to cost spikes, telemetry volume, sampling not working, data caps, high ingestion, or unexpected billing. To get started, see Troubleshoot high data ingestion in Application Insights.
Django apps
If your app uses Django and is either failing to start or using incorrect settings, make sure to set the DJANGO_SETTINGS_MODULE environment variable. See the Django Instrumentation section for details.
For the latest updates and bug fixes, consult the release notes.
If you have questions or need help, create a support request, or ask Azure community support. You can also submit product feedback to Azure feedback community.


