Note
Access to this page requires authorization. You can try signing in or changing directories.
Access to this page requires authorization. You can try changing directories.
Data risk graph (preview) in Data Security Investigations (preview) provides a visual investigation experience that combines asset and activity data into a single view. Powered by Microsoft Sentinel integration, it summarizes the previous 30 days of activity for any file scoped in your investigation. It helps you identify risky user accounts that interacted with content of interest and analyze the sequence of events leading up to recent incidents. By enriching analysis with activity insights, data risk graphs can help you resolve your data security incidents faster and with greater confidence.
For more information about Microsoft Sentinel integration, see Learn about Microsoft Sentinel in Microsoft Purview.
Note
Admin units aren't supported in the data risk graph. If you're scoped to an admin unit, data doesn't appear in data risk graphs.
Supported activities in data risk graph
The data risk graph currently supports the following exfiltration activities:
- Anonymous links created in SharePoint or OneDrive
- Anonymous links used via SharePoint or OneDrive
- Company links created in SharePoint or OneDrive
- File downloads from SharePoint and OneDrive
- Files renamed in SharePoint and OneDrive
Before you begin
Before you can use data risk graphs in Data Security Investigations (preview), complete the following steps:
- Learn about pay-as-you-go billing in Microsoft Sentinel for your organization.
- Configure the prerequisites for Microsoft Sentinel data lake and Microsoft Sentinel graph
- Review the changes made when onboarding to Microsoft Sentinel data lake and Microsoft Sentinel graph
- Create an investigation in Data Security Investigation (preview).
Configure data risk graph
Important
Microsoft recommends that you use roles with the fewest permissions. Minimizing the number of users with the Global Administrator role helps improve security for your organization. Learn more about Microsoft Purview roles and permissions.
After you complete the prerequistites, complete the following steps to configure data risk graph in Data Security Investigations (preview):
Go to the Microsoft Purview portal with an account assigned the Global Administrator or Security Administrator role.
Select the Data Security Investigations (preview) solution card, then select Overview in the left nav.
In the Setup tasks section, select Set up data lake and data risk graph (preview).
If you don't have the correct permissions to set up the data lake, a notification appears to contact a global or billing administrator in your organization.
On the Setup tab on Set up data lake & risk graph (preview), configure the following settings:
- Subscription: Enter the Azure subscription you want to use. Your selected subscription must be valid and accessible. You must be a subscription owner.
- Resource group: Enter the resource group you want to use. Your selected resource group must be valid and accessible.
Important
After the data lake is provisioned for a specific Azure subscription and resource group, you can't migrate it to a different subscription or resource group.
Select Setup.
Important
When the data risk graph is first created, it includes the most recent seven days of data. As the data risk graph refreshes over time, the look-back window expands up to a maximum of 30 days. It might take some time for the data risk graph to reach the full 30-day window, so expect gradual growth after initial setup.
The set up process begins and onboarding might take up to 60 minutes to complete. You can close the setup panel while the process is running. After the onboarding process completes, you see Complete on Set up data lake & risk graph (preview). The data risk graph shows events that occur after your Microsoft Sentinel data lake was created or onboarded.
Initial processing of data and data risk graph availability for an investigations might take 24-48 hours.
Important
You always have one data lake. If you already onboarded to the data lake with another Microsoft service, your existing data lake is used. If you never onboarded to the data lake, onboarding in Data Security Investigations (preview) enables Microsoft Sentinel data lake and graph in the Defender portal.
Use data risk graph (preview)
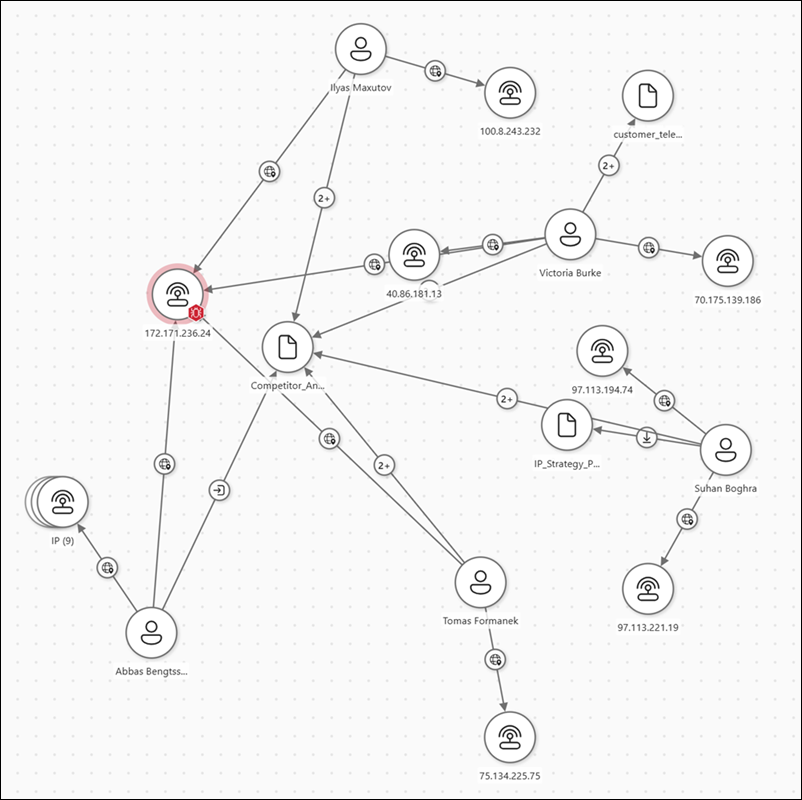
Data risk graph (preview) in Data Security Investigations (preview) uniquely visualizes correlations between impacted data, users, and their activities. It provides critical context to guide mitigation and next steps. For example, upon uncovering a highly sensitive document, data risk graphs give you visibility into which users downloaded it or if they accessed it from a risky IP address. This visibility lets you uncover new nodes to a data security incident, like additional users or new content that requires investigation.
To view the data risk graph for an investigation, you must be assigned to at least one built-in Data Security Investigations (preview) role group:
- Data Security Investigations Administrators
- Data Security Investigations Investigators
- Data Security Investigations Reviewers
For more information about role groups, see Assign permissions in Data Security Investigations.
To use the data risk graph in Data Security Investigations (preview), complete the following steps:
Go to the Microsoft Purview portal with an account assigned to a Data Security Investigations (preview) role group.
Select the Data Security Investigations (preview) solution card, then select Cases in the left nav.
Select an investigation to review, then select one of the following options:
- On Summary, select Manage scope on the Investigation scope card.
- Select the Analysis tab to list items included in the Investigation scope.
Select items (up to 100) included in the scope, then select Explore insights.
Note
Explore insights isn't available unless you configure Data Security Investigations (preview) for Microsoft Sentinel data lake and graph.
Filter the time as applicable and select individual data risk graph nodes for more information about each connection during triage.
Expand relationships in the graph by selecting the + icon on users or assets.
The data risk graph contains several nodes. Selecting a node shows details about the node:
- User details: Shows information about users associated with the investigation. This information includes organization information for each user, including User Principal Name (UPN), labels, location, job title, and more.
- Relationships: Shows information about starting and ending connections between nodes. This information includes starting and last connection dates, relationship types, and more.
- IP addresses: Shows information about each IP address node.
- Data details: Shows information about files and sites. This information includes the object location, type, labels, and more.
You can view data risk graph information for users based on the last 30 days of activity. This duration is fixed and can't be extended.