Note
Access to this page requires authorization. You can try signing in or changing directories.
Access to this page requires authorization. You can try changing directories.
APPLIES TO: ![]() Power BI Desktop
Power BI Desktop ![]() Power BI service
Power BI service
ArcGIS for Power BI is a mapping visualization that helps you enrich your data, reports, and dashboards. It offers mapping capabilities, demographic data, location analytics, and spatial analysis tools. Use these tools to show patterns and add insight to your data. Create and view ArcGIS map visualizations in the Power BI service or Power BI Desktop. For details, see Considerations and limitations. This tutorial uses Power BI Desktop.
Use ArcGIS for Power BI's mapping capabilities and smart map themes to choose the best way to show your data, highlight areas in your report, and use local demographics. These capabilities add regional context and refine the symbology to improve your report's clarity.
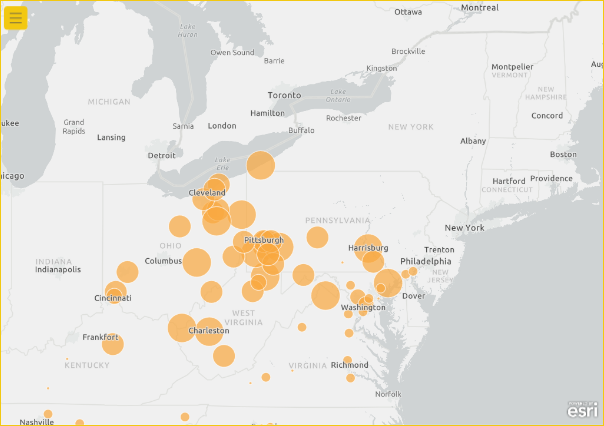
Combining authoritative data layers with spatial analysis helps you explore the complexities behind your Power BI data. For example, use ArcGIS for Power BI to add regional insight to sales figures. The following example shows regional sales by size by city against a demographic layer of U.S. Census average household income (dark blue shows higher income) in the selected area.
This demographic layer helps you see how household income and store locations affect current sales and future purchasing, advertising, and site selection.
Tip
To learn how report consumers experience ArcGIS for Power BI, see Interact with ArcGIS maps that are shared with you.
For more information, go to Esri's ArcGIS for Power BI:
- See ArcGIS for Power BI maps.
- Get training and documentation in Esri's ArcGIS for Power BI online help.
Note
As a report designer, you can share an ArcGIS for Power BI map with a colleague who can view and interact with it. Your colleague can't save changes. You can't create an ArcGIS for Power BI map on a mobile device, but you can view and interact with it.
User consent
Esri provides ArcGIS for Power BI. Your use of ArcGIS for Power BI is subject to Esri's terms and privacy policy. Accept the terms in the consent dialog to use the ArcGIS for Power BI visualization. The consent dialog appears only the first time you use ArcGIS for Power BI.
Prerequisites
Install Power BI Desktop and download the Retail Analysis sample PBIX file. Or use the Power BI service with ArcGIS for Power BI to create the map visualization.
Create an ArcGIS for Power BI map visualization
Start by adding a new page to your report.
- On the menu bar, select File > Open report.
- Locate the Retail Analysis sample PBIX file on your local machine.
- Open Retail Analysis Sample in report view
 .
. - Select
 to add a new page to the report.
Add a map to the report
To add a map to a report, follow these steps:
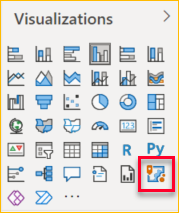
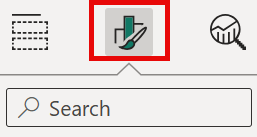
Select the ArcGIS for Power BI icon in the Visualizations pane.
An Esri user consent dialog might appear the first time you use ArcGIS for Power BI. Select OK to continue.
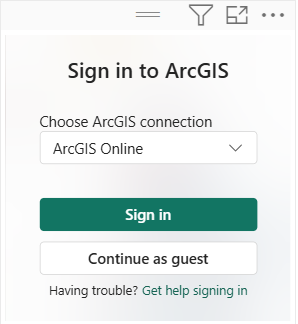
Power BI adds an empty template to the report canvas and provides an optional sign-in prompt.
This tutorial uses the Standard version of ArcGIS for Power BI. However, if you sign in to a valid, licensed ArcGIS account, you have access to more features. For details about account types, visit the ArcGIS for Power BI online help.
Select Store > City in the Fields pane, then drag it to the Location field well in the Visualizations pane. Optionally drag coordinate fields to the Latitude and Longitude field wells.
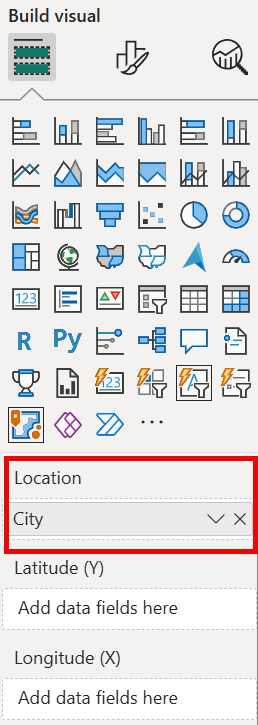
Drag Sales > Last Year Sales from the Fields pane to the Size field well in the Visualizations pane to size the symbols.
The map shows Last Year Sales for U.S. Cities with Counts and Amounts (size) symbols. Zoom in and pan to explore the data.
You've created your first ArcGIS for Power BI visualization. Next, learn how to refine and format it using basemaps, location types, themes, and more.
Embed a map enabled ArcGIS for Power BI report
Embed a map enabled ArcGIS for Power BI report that contains private, secure, or proprietary ArcGIS data in a secure website or app. Report viewers must sign in to an ArcGIS account. For general information about embedding ArcGIS content, see Content sharing.
Format an ArcGIS for Power BI visualization
To access ArcGIS for Power BI formatting features, in the Visualizations pane, select the Format tab to view the formatting options.
ArcGIS map formatting options include:
- Layers: Change the Title of the Layers list, specify if the Layers list (Show layers) button
 is visible in the expanded Map tools, define the position of the Layers list, and anchor the list over the map. The Layers list is visible by default.
 - Map tools: Specify if the Zoom tools (navigation buttons) are visible on the map, specify if the Basemaps button
 is visible in the expanded Map tools, lock the map extent in its current position, and define the position of the infographics cards on the map. Zoom tools and the Basemaps button aren't visible by default.
 - Location type: Specify the country or region in which your data is located to improve the accuracy of locations on your map. If your data is in a single country or region, choose that country or region from the drop-down list. If your data is global, choose World.
- Search: Specify if the Search button
 is visible in the expanded Map tools. Search is visible by default.
Note
Reset to default returns all formatting options to their original configuration.
Edit an ArcGIS for Power BI map
After you add data to the map visualization, the Map tools button  becomes available.
Note
This tutorial shows only the features and options available in the Standard version of ArcGIS for Power BI. If you're signed in to a valid, licensed ArcGIS account with the proper licensing, you'll have access to more features.
Select the Map tools button
to expand the tools.
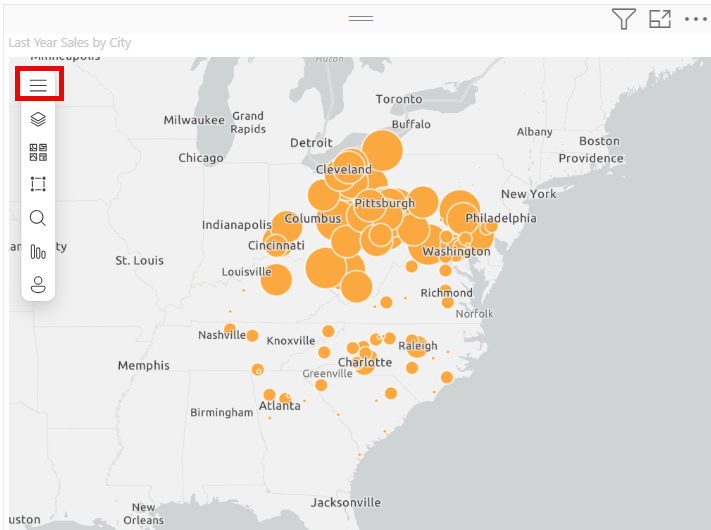
The map tools expand to show the available features. Each feature, when selected, opens a task pane that provides detailed options.
Tip
Esri provides comprehensive documentation about using ArcGIS for Power BI.
Change the basemap
A basemap provides a background, or visual context, for the data in a map. For example, a basemap showing streets can provide context for your address data. The Standard account includes four basemaps: Dark Gray Canvas, Light Gray Canvas, OpenStreetMap, and Streets.
To change the basemap, follow these steps:
Select to expand the Map tools
, if necessary, and then select Basemap
to display the gallery of available basemaps.Note
You must have Basemaps set to On in the Visualizations pane on the Format tab
 .
.Select the Dark Gray Canvas basemap.
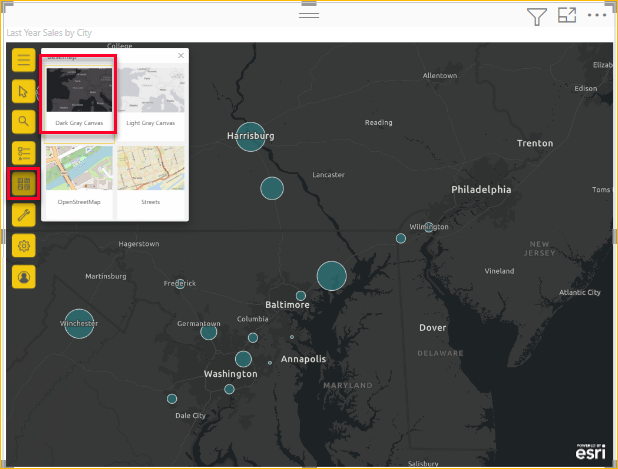
The map updates using the new basemap.
For more information about changing the basemap, visit the ArcGIS for Power BI online help.
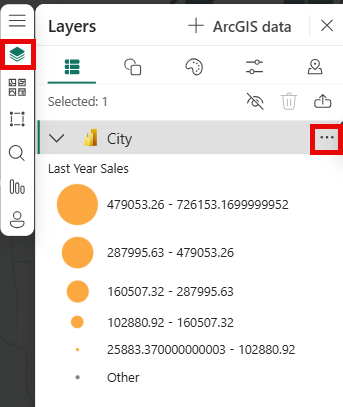
Show map layers
In ArcGIS for Power BI, you work with geographic data through layers. Layers contain logical collections of geographic data that are used to create maps. They're also the basis for geographic analysis.
To display the Layers list, select
to expand the Map tools, if necessary, and select Layers
.
The Layers list displays your data as a layer added to the basemap. Configure the layer’s dynamic options to customize how the layer’s data is displayed.
Different options appear in the menu depending on the type of data in your selected layer. For example, you can change the Symbology and Location type settings for a layer created using Power BI data, like the City layer you created for this tutorial, but those options aren't available for reference or drive-time layers.
For more information about working with layers, visit the ArcGIS for Power BI online help.
Specify the location type
ArcGIS for Power BI uses geo enabling technology to accurately position location data on the map and automatically render items as points or boundaries by default, based on the type of data they represent. For example, a latitude, longitude coordinate is rendered as a point on the map, whereas a city is rendered as a boundary (polygon).
Improve location accuracy by establishing the location type.
Boundaries are typically standard geographic areas, such as countries/regions, provinces, and ZIP codes. When you establish boundaries and a specific country/region for your data locations, you can then choose from a subset of related, standard boundaries, such as census tracts, districts, or municipalities. Various location types are available for each country or region.
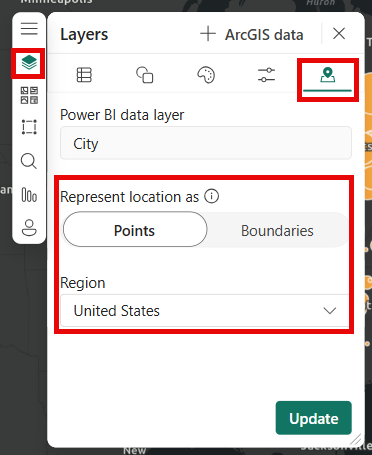
To modify your data's location type, follow these steps:
Select to expand the Map tools
, if necessary, and select Layers
.On your data layer, select more options and choose Location type from the dropdown menu.
Accept the default values to render the locations as points on the map and select the United States.
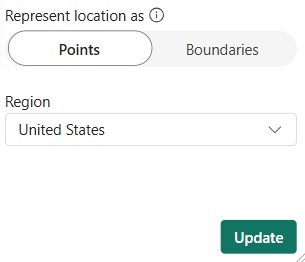
Select Update to save your settings.
For more information about specifying the location type, visit the ArcGIS for Power BI online help.
Customize the map's symbology
ArcGIS for Power BI uses values in the Data pane to determine how it should render locations on your map with predictive smart mapping. Use the Symbology feature to modify the default styles.
Choose a different style theme and customize the symbols and colors used to represent locations on the map. The available themes and style options depend on the values you added to the Fields pane.
To change a layer's symbology, follow these steps:
Select to expand the Map tools
, if necessary, and select Layers
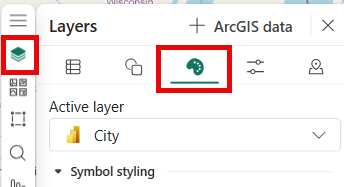
.On your data layer, select the Symbology,
 icon.
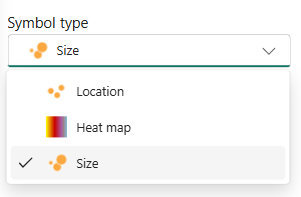
icon.The Symbol type dropdown appears, displaying the available symbol type themes.
Change the map theme
In this tutorial, because you added values to both the Location and Size fields, the map uses the Counts and Amounts (size) theme by default.
To change the theme, follow these steps:
Choose some of the other map themes to see how your map changes.
Note
Not all themes appear in the style pane if your selected data values don't match the options for that style.
For this tutorial, choose the Size theme.
For more information about themes, visit the ArcGIS for Power BI online help.
Symbol style options
Symbol styles allow you to fine-tune how data is presented on the map. The available, default symbol styles are based on the selected location type and theme. The available style options presented to you vary depending on which field wells contain values and the nature of those values.
To change the symbol style, follow these steps:
On the Layers menu, select the Style Options tab.
The Symbology library is dynamic and responds to the nature of your data and selected theme. In Symbology, change the shape, fill color, and transparency of symbols and outlines, and set a color ramp. Depending on the data and theme, classification settings—area of influence, method, classes, options to exclude null values, size range, and others—might also appear on this tab.
For more information about the different data classification types, visit the ArcGIS for Power BI online help.
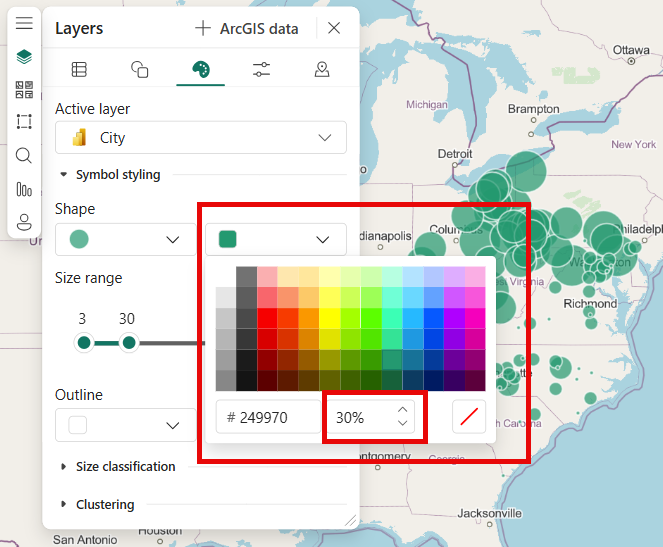
Expand the Symbology category and select Advanced options.
Select Fill.
Change your symbol color to green by dragging the color sliders and set Fill transparency to 30 percent.
This example shows the theme set to Counts and Amounts (size) with a green symbol set to 30 percent transparency.
Analyze your data
ArcGIS for Power BI provides tools to help you discover patterns in your data and tell a compelling story with a map.
Analysis features include:
- Select locations to highlight data areas on the map
- Search for a specific address, place, or point of interest
- Add a reference layer to provide more regional context to enrich your data
- Find locations within a specified radius or drive-time area
- Add interactive infographic cards that display demographic details about the region surrounding your data
Select locations
Choose from several tools to select locations on the map.
To display the selection tools, follow these steps:
Select to expand the Map tools
, if necessary, and select Selection tools  to expand the toolset.
There are several selection tools. The tools available in the Selection tools menu vary depending on the type of layer that's currently active.
Tool Description Single select 
- This tool is the default selection tool.
- With this tool active, click a feature to select it.
- Press Ctrl and click to add or remove multiple features one at a time.
- When this tool is active, you can select data features on the map to select them and trigger interactions with other visualizations.
- When this tool is active, you can select a pin or a feature on a reference layer to display its tooltip.
Select by rectangle 
- With this tool active, place the cursor on the map and drag a rectangle to include multiple features within the drawn rectangle.
- Press Ctrl and drag to add or remove multiple features from the current selection.
- When this tool is active, you can't pan the map.
- Press Esc to cancel drawing and pan the map.
- To resume selecting, click a selection tool.
Select by circle 
- With this tool active, place the cursor on the map to set the focus (center) point from which the circle starts and include multiple features within the circle.
- Press Ctrl and drag to add or remove multiple features from the current selection.
- When this tool is active, you can't pan the map.
- Press Esc to cancel drawing and pan the map.
- To resume selecting, click a selection tool.
Select by polygon 
- Draw polygon vertices on the map.
- Double-select to finish; selects all features within the polygon boundary.
- Press Ctrl while drawing to enable snapping.
- Press Esc to cancel.
- Select a selection tool to resume.
Select by freehand polygon 
- With this tool active, drag a freehand shape on the map to select features within that shape.
- Press Ctrl and drag to add or remove multiple features from the current selection.
- When this tool is active, you can't pan the map.
- Release the mouse (cursor) or press Esc to stop drawing and pan the map.
- To resume selecting, click a selection tool.
Reference layer select 
- Visible only if you added a reference layer to the map and the reference layer is the Active layer.
- Select features by clicking areas on the reference layer.
- Features that are within a delimited area on a reference layer are highlighted. Features in other areas of the map are unavailable.
Drive-time select 
- Selects data features within the defined area.
- Visible only when a search area layer (buffer or drive-time area) is the Active layer.
Clear selection 
- This tool clears all selections.
- It's only active after selections have been made on the map.
Select one or more locations or features on the map.
You can select a maximum of 250 data points at a time. When the Buffer/Drive Time pane is active, map selection tools are temporarily unavailable.
For more information about selection tools, visit the ArcGIS for Power BI online help. For more information about reference layers, see Add a reference layer. For more information about buffer or drive time areas, see Create buffers and drive time areas.
Pin a location
Pin a specific address, place, or point of interest on the map. For this tutorial, you’ll search for the Pittsburgh International Airport.
To pin a location, follow these steps:
Select to expand the Map tools
, if necessary, and select Search
the Search pane.Type the keywords Pittsburgh international in the search field.
Keywords can include an address, place, or point of interest. As you type, similar recent searches or suggestions based on similar keywords appear.
From the results list, choose Pittsburgh International Airport, and select Close.
A symbol appears on the map, and the map automatically zooms to the location, pinning it for the duration of your session.
Note
Pins remain only for the current session; you can't save a pinned location with the map. For more information, see Pin a location in the ArcGIS for Power BI online help.
Add a reference layer
When you use Power BI data to create an ArcGIS for Power BI map visualization, you're creating a data layer. You can then add reference layers that provide context to your data. For example, if your data layer shows the location of fast-food restaurants, you can add a reference layer showing the proximity of nearby schools, the consumer spending habits of the community, or the age demographic of the surrounding neighborhood.
Reference layers can consist of regional demographic data, such as income, age, and educational attainment. They can also include publicly shared feature layers available from ArcGIS Online that provide various types of information about areas surrounding the locations on your map. Reference layers add context to help you see broader patterns.
After you add a reference layer to a map, you can create a join between the reference layer and Power BI data attributes to gain more insight into your data. To learn more about joining layers, visit the ArcGIS for Power BI help.
Add a demographic layer
The Standard ArcGIS for Power BI account includes a curated selection of United States Census Bureau demographic information layers that help contextualize your data from Power BI.
To add a demographic layer, follow these steps:
Select to expand the Map tools
, if necessary, and select Layers
to expand the toolset.Select the +ArcGIS data tab.
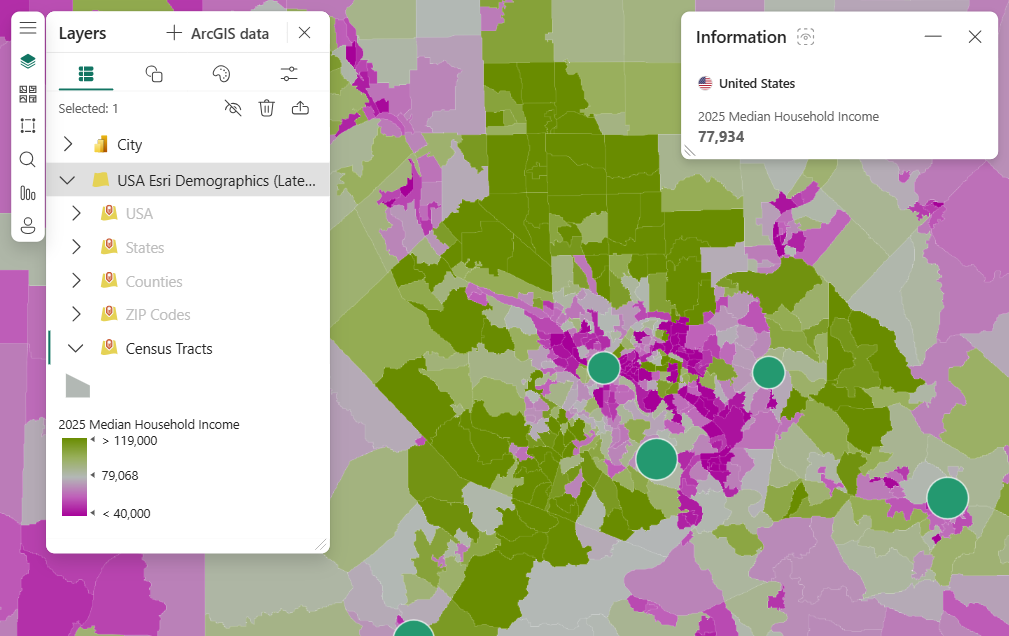
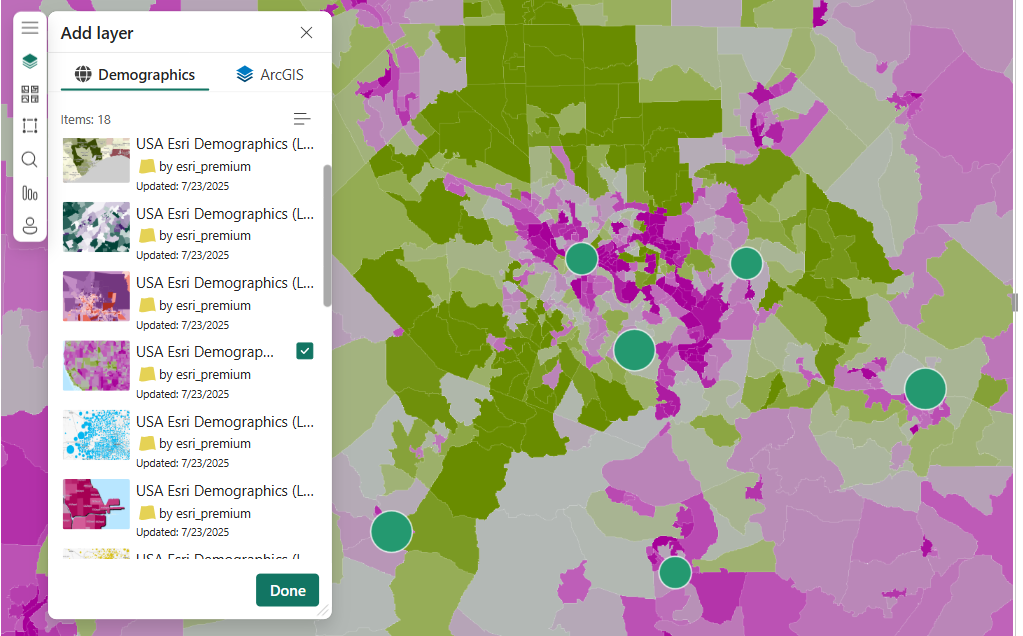
The Add layer pane appears, displaying the Demographics tab and its selection of layers.
View these layers as a list
 or detailed view
Scroll through the gallery, and select the layer you want to add to your map.
For this tutorial, find the 2025 Median Household Income layer and select the checkbox to add.
The map updates to include the reference layer.
Demographic reference layers are interactive and show tooltips when you select areas. You can select an area to view a tooltip containing more information about that area. You can also select areas on the map that fall within an area on the reference layer.
Add a reference layer from ArcGIS
ArcGIS for Power BI lets you search for publicly shared feature layers on ArcGIS. This library contains thousands of reference layers that provide information curated to enrich your data. When you sign in to ArcGIS for Power BI using a valid, licensed ArcGIS account, you get access to more data content that you can share within your organization. This data content includes the authenticated and extensive library of ArcGIS content, such as the ArcGIS Living Atlas of the World. Share this data content within your organization and your organization's groups.
Note
Layers added from ArcGIS must support HTTPS.
For this tutorial, because you're using a Standard account, only publicly shared content appears in the search results.
To add an ArcGIS reference layer, follow these steps:
In the Reference pane, select the ArcGIS tab.
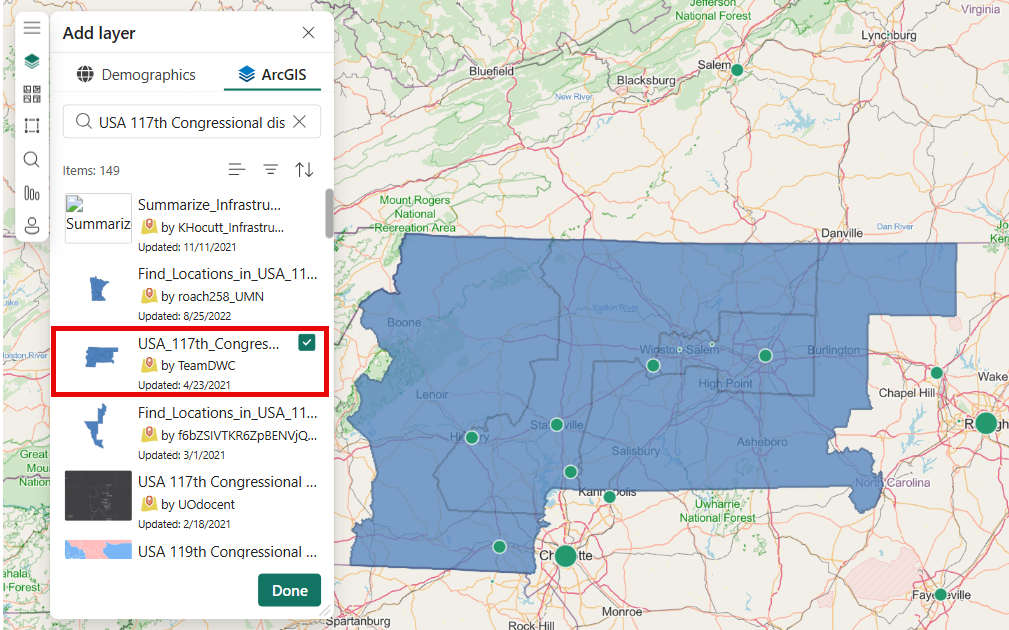
In the search field, type USA Congressional districts and press Enter.
The gallery populates with several possible results.
Locate the USA 117th Congressional Districts layer, and select the check box to add.
The map updates to include this ArcGIS public reference layer.
ArcGIS reference layers are interactive and display tooltips for selected areas. Select an area to view a tooltip containing more information. You can also select areas on the map that fall within an area on the reference layer.
Find nearby locations
You can use locations on your map, including a pinned location, as a starting point to find and select nearby locations on your map. For example, if you search for a particular place of interest, you can select locations on your map that are within a specified drive time or distance (ring buffer) of that place.
In this tutorial, you use the Pittsburgh International Airport you pinned earlier as a starting point to find locations within 50 miles of the airport. Use similar steps to find locations within a specified drive time.
To find locations within a specific distance, or ring buffer, of the point of origin, follow these steps:
Select to expand the Map tools
, if necessary, and select Analysis  to expand the toolset.
Select Buffer/Drive-time
 .
.The Buffer/Drive Time pane appears.
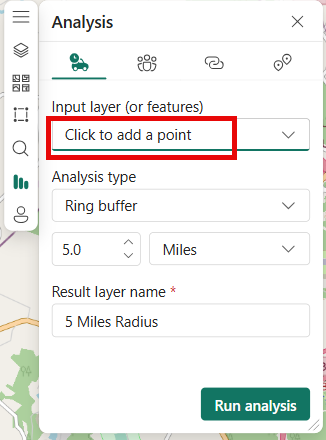
From the Input layer (or features) menu, choose the starting point for the calculation.
You can select a layer in the map, use your current location, or choose Click to add a point to select a location manually.
Choose Click to add a point and, on the map, select the Pittsburgh International Airport location you pinned earlier.
Tip
If your map is styled using Clustering, you won't be able to select the clustered locations on the map. Choose a different theme and try again.
From the Analysis type menu in the Buffer/Drive Time pane, choose how the area around the point you selected is measured:
- To use a distance-based measurement, select Ring buffer. Set the unit of measurement using the drop-down menu and change the distance using the text box or arrow buttons (maximum 100 miles).
- To use a time-based measurement, select Drive Time. Change the amount of time using the text box or arrow buttons (maximum 30 minutes).
For this tutorial, choose Ring buffer and 50 miles, and select Run Analysis.
The map shows a circle surrounding the pinned airport location.
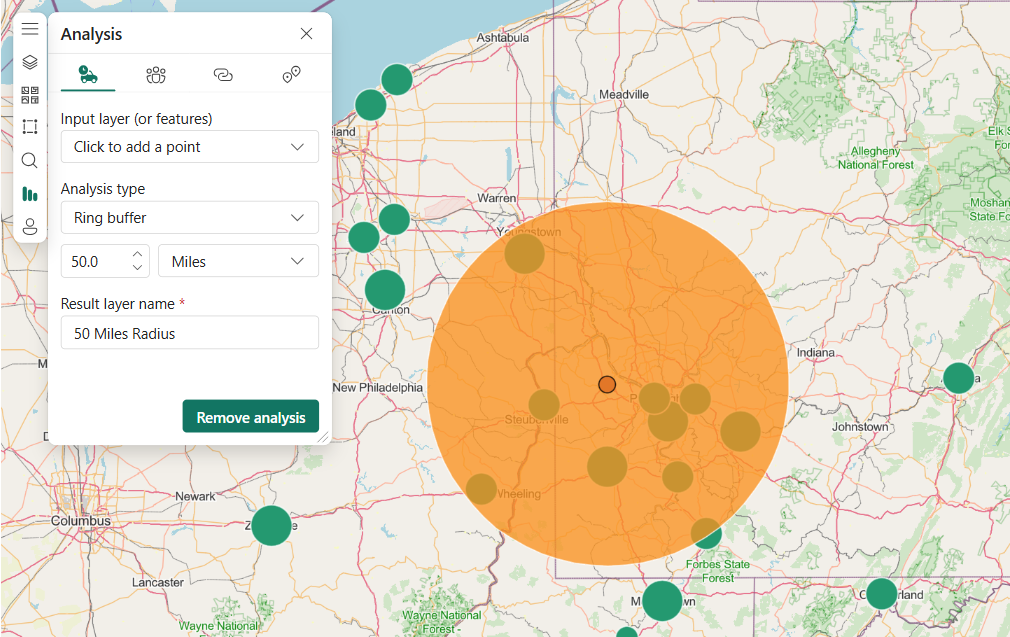
The ring buffer area also appears as a layer in the Layers list. You can rename the layer, show or hide it
 , change the sequence in which it's shown (to bring Last Year Sales to the top) by dragging items in the list of layers, or remove it from the map, as you can with each layer.
Note
A map can contain only one search area at a time. If a search area already exists, you must delete it before you can create a new one.
Close the Drive Time pane to reactivate the map selection tools.
For more information about finding nearby locations, visit the ArcGIS for Power BI online help.
Add infographics cards
Like reference layers, infographics cards provide more details about areas on the map. Infographics cards are layered on top of the map and display specific demographic information about either the area immediately surrounding a selected location, or about the general area displayed in the current map extent. You can choose from a wide range of demographic categories, such as population details, age distribution, income levels, and more.
Infographics cards update dynamically based on the layer or feature in focus. They're configurable, and the properties for an infographics card depend on the chosen demographic category.
To add an infographics card to a map, follow these steps:
Select to expand the Map tools
, if necessary, and Analysis tools
to expand the toolset.Select Infographics
 . The Infographics pane appears.
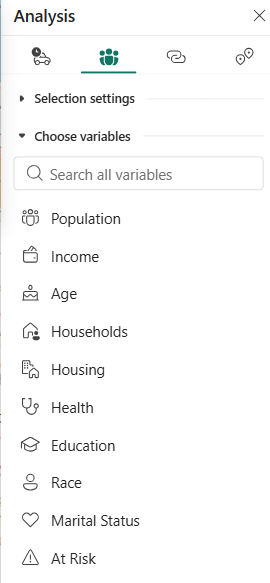
The ArcGIS for Power BI visualization built into Power BI includes a limited number of demographics for the United States only. When you sign in to ArcGIS for Power BI using a valid, licensed ArcGIS account, you can choose from thousands of United States and global demographic variables.
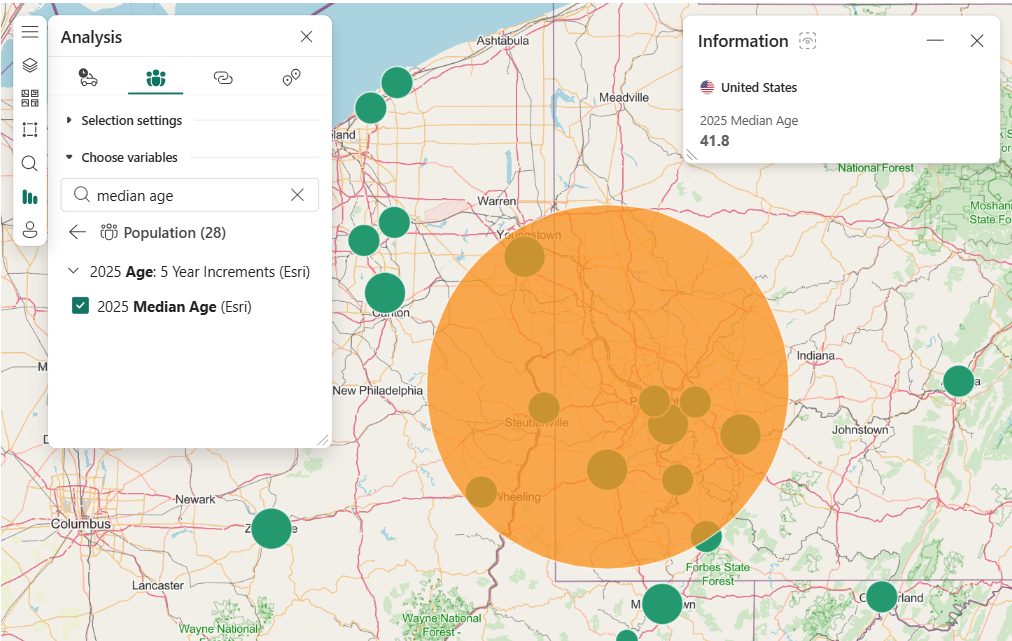
Select the arrow next to a category to view the variables available for that category. For example, select Population to expand that category and then expand Age 5 Year Increments to view available subcategories.
For this tutorial, select Population > (Year) Age: 5-Year Increments > (Year) Median Age.
An infographic appears on the map displaying 2025 Median Age for the current extent of the map.
Tip
You can also search for a demographic by name in the Infographics pane search field.
For more details about adding infographics cards, visit the ArcGIS for Power BI online help.
Get help
Esri provides online help for ArcGIS for Power BI.
Access the ArcGIS for Power BI online help from the visualization:
Expand Map tools
if needed, then select Settings  .
.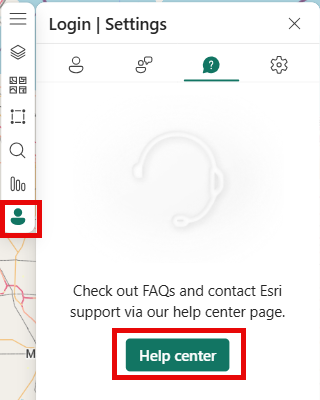
In the Settings pane, select Help.
In the confirmation window, select OK.
The ArcGIS for Power BI online help opens in a browser window.
Use these resources:
- Find answers in the frequently asked questions about ArcGIS for Power BI.
- Ask questions, get the latest information, report issues, and find answers in the Power BI ArcGIS for Power BI community thread.
- Suggest an improvement on the Power BI Ideas list.
In the Settings pane, view dynamic map attribution for the current extent, read about the Esri EUEI (End User Experience) program, and turn Send usage data to Esri on or off.
Manage ArcGIS for Power BI in your organization
Power BI lets designers, tenant administrators, and IT administrators manage ArcGIS for Power BI. The next sections outline what each role does.
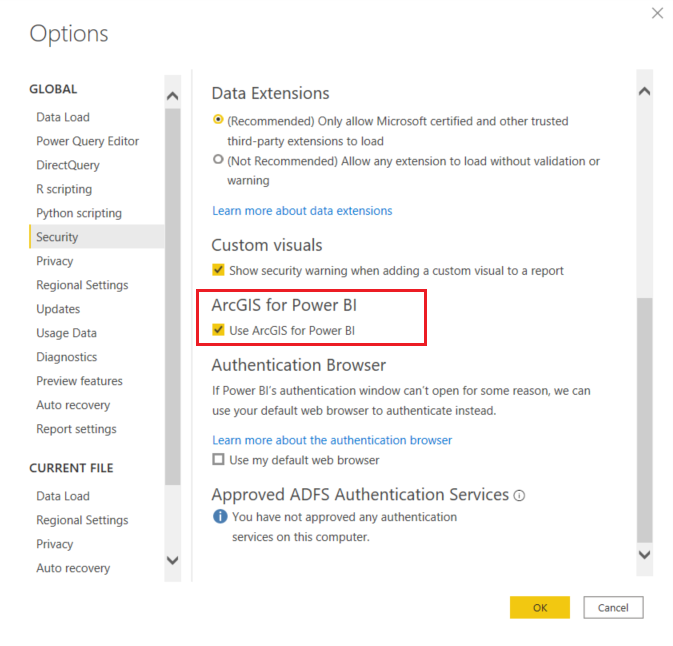
Designer options
In Power BI Desktop, disable ArcGIS for Power BI on the Security tab. Select File > Options and settings > Options > Security. When disabled, ArcGIS doesn't load by default.
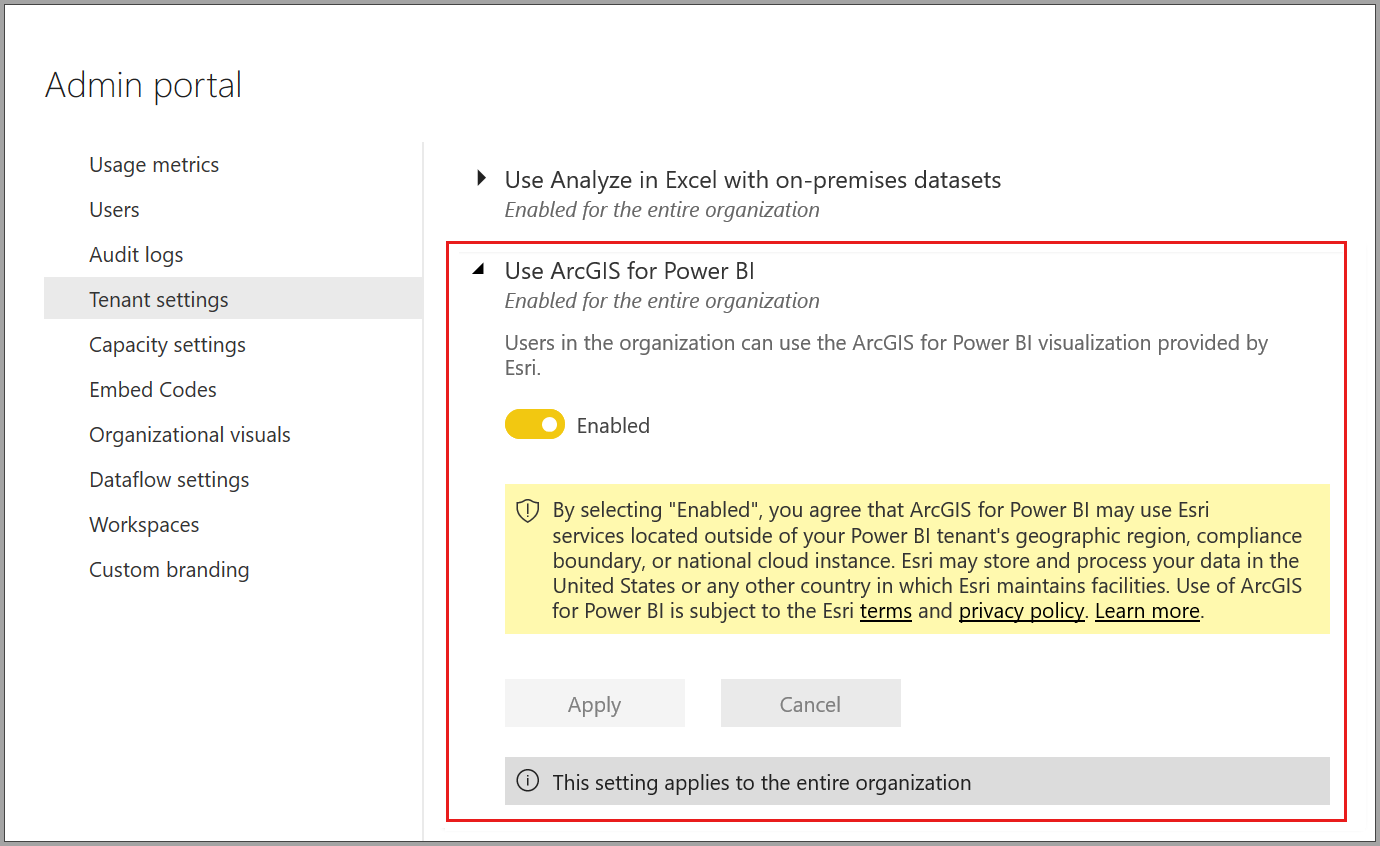
Tenant administrator options
In the Power BI service, turn off ArcGIS for Power BI for all users. Select Settings > Admin Portal > Tenant settings. When disabled, the ArcGIS for Power BI icon doesn't appear in the Visualizations pane.
IT administrator options
Power BI Desktop lets you use Group Policy to disable ArcGIS for Power BI across your organization.
| Attribute | Value |
|---|---|
| Key | Software\Policies\Microsoft\Power BI Desktop |
| valueName | EnableArcGISMaps |
Set the decimal value:
- 1 to enable ArcGIS for Power BI.
- 0 to disable ArcGIS for Power BI.
Considerations and limitations
ArcGIS for Power BI is available in these services and applications:
| Service or application | Availability |
|---|---|
| Power BI Desktop | Yes |
| Power BI service (powerbi.com) | Yes |
| Power BI mobile apps* | Yes |
| Power BI publish to web | Yes, if the designer is signed in with a valid, licensed ArcGIS account |
| Power BI Embedded | Yes, if the designer is signed in with a valid, licensed ArcGIS account |
| Power BI service embedding (powerbi.com) | No |
| Power BI Report Server | Yes, if signed in with a valid ArcGIS Enterprise account through Report Server (online environment only). Not supported in a disconnected environment or with ArcGIS Online. Using ArcGIS for Power BI with Report Server consumes ArcGIS credits. For more information, see Understand credits. |
*In mobile environments, view maps created with the ArcGIS for Power BI visual included with Power BI (Standard account). Maps with premium ArcGIS content aren't supported on mobile.
In services or applications that don't support ArcGIS for Power BI, the visual shows as empty with the Power BI logo.
ArcGIS for Power BI features
This table compares standard features for all Power BI users and features for signed-in ArcGIS users:
| Feature | ||
|---|---|---|
| Basemaps | Four basic basemaps | All Esri basemaps, your organization's basemaps, and any custom basemaps |
| Geocoding | 3,500 locations per map | 10,000 locations per map |
| 10,000 locations per month | No monthly limit | |
| Reference layers | 10 curated reference layers with US demographic data | Access all global web maps and layers defined by your ArcGIS organization or account. Includes ArcGIS Living Atlas of the World maps and layers (feature services). |
| Publicly shared feature layers in ArcGIS | Publicly shared feature layers in ArcGIS | |
| Infographics | Curated gallery of US demographic variables | Access all global demographic variables defined by your ArcGIS organization or account. Includes the ArcGIS GeoEnrichment data browser |
| Up to two variables | Up to five variables | |
| Supports Drive Time and Radius settings | Supports all distance and travel settings |
Related content
- Interact with an ArcGIS map that has been shared with you
- ArcGIS for Power BI blog posts announcing ArcGIS for Power BI updates
- More questions? Try asking the Esri ArcGIS for Power BI Community.
- Esri's ArcGIS Maps for Power BI documentation
- Esri's ArcGIS Maps for Power BI product page
- Esri's Community site for Power BI