Note
Access to this page requires authorization. You can try signing in or changing directories.
Access to this page requires authorization. You can try changing directories.
APPLIES TO: ![]() Power BI Report Builder
Power BI Report Builder ![]() Power BI Desktop
Power BI Desktop
Power BI Report Builder lets you author paginated reports—print-friendly, multi-page, pixel-precise reports that render all rows in a table. You design a report definition (what data, where to get it, how to lay it out), preview it locally, then publish to the Power BI service. For more information, see What are paginated reports in Power BI?.
Ready to start authoring? Install Power BI Report Builder from the Microsoft Download Center.
Prefer videos? See the Power BI Paginated Reports in a Day course.
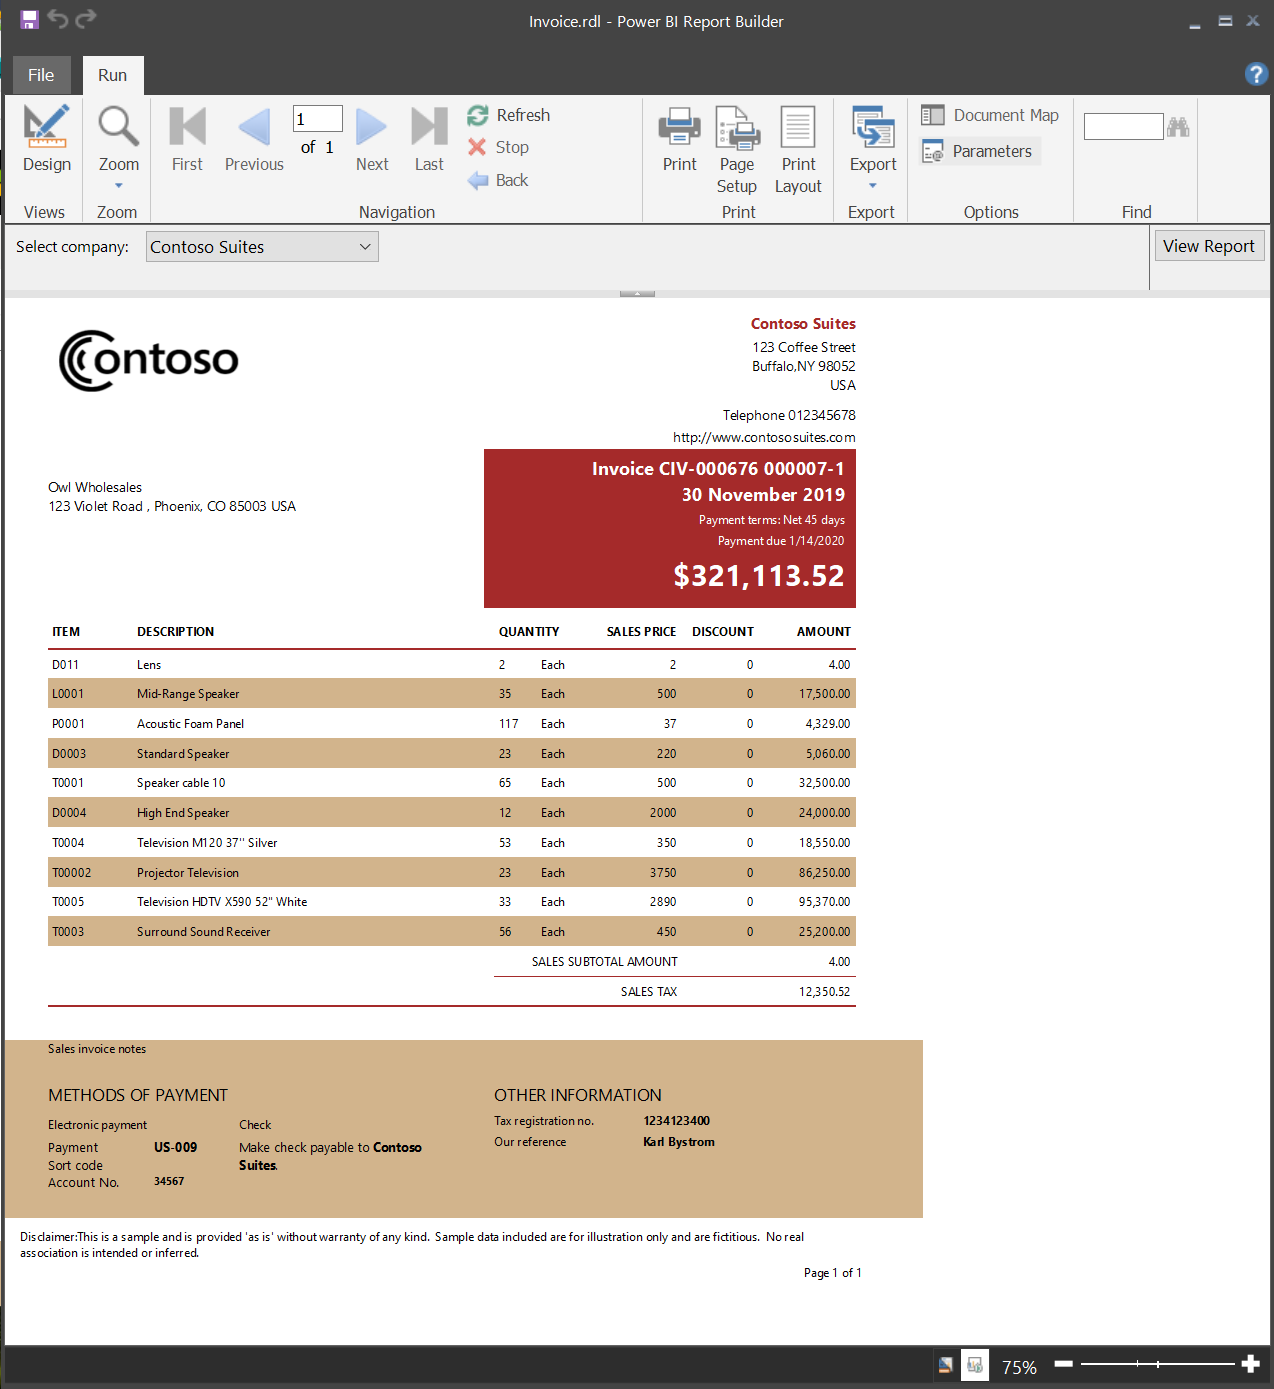
The following sample invoice report is one of several you can download—see sample Power BI paginated reports.
Key capabilities (at a glance)
Here's a quick overview of what you can do with Power BI Report Builder:
| Scenario | Supported examples |
|---|---|
| Data sources | SQL Server, Oracle, Power BI semantic models, Analysis Services, Azure SQL, OData, more |
| Layout control | Precise page sizing, headers/footers, repeating groups, nested regions |
| Expressions | Rich expression language for conditional formatting and calculations |
| Delivery | Interactive, export (PDF, Excel, Word, CSV, XML, MHTML) |
| Distribution | Email subscriptions, deployment pipelines |
| Governance | Sensitivity labels, workspace permissions, audit logs |
System requirements
See system requirements on the download page.
Prerequisites
License requirements for Power BI paginated reports (.rdl files) are the same as for Power BI reports (.pbix files).
- You don't need a license to download Power BI Report Builder from the Microsoft Download Center for free.
- With a free license, you can publish paginated reports to My Workspace in the Power BI service. For more information, see Feature availability for users with free licenses in the Power BI service.
- With a Power BI Pro license or a PPU license, you can publish paginated reports to other workspaces. You also need at least a contributor role in the workspace.
- You need Build permission for the dataset.
Start with the Table, Matrix, or Chart wizard
Create a data source connection, build a dataset query, select a layout and style, add accessibility row properties, and customize your report.
Start with the Map wizard
Create reports that display aggregated data on geographic or geometric backgrounds (SQL spatial, Environmental Systems Research Institute [ESRI] shapefile, or Bing map tiles).
Design your report
The following features help you design effective paginated reports in Power BI Report Builder:
- Create paginated reports with table, matrix, chart, and free-form layouts. Use table layouts for column data, matrix for pivot-style summaries, chart for trends, and free-form for invoices or mixed content.
- Report from many data sources. Use relational or multidimensional sources such as SQL Server, Analysis Services, Oracle, or Power BI semantic models.
- Modify existing reports. Open and refine reports originally authored in SQL Server Data Tools.
- Modify your data. Filter, group, sort, and add expressions.
- Add charts, gauges, sparklines, and indicators. Summarize patterns visually.
- Add interactive features (document maps, drillthrough, show/hide toggles) plus parameters for user filtering.
- Embed or reference images and other resources (internal or external).
Manage your report
Managing your paginated reports in Power BI Report Builder involves several key tasks to ensure your reports are organized, accessible, and distributed effectively:
- Save the report definition locally or to the service.
- Select export formats (PDF, Excel, Word, CSV, XML, MHTML, web view).
- Set up subscriptions. After publishing, schedule email delivery.
Use deployment pipelines with paginated reports
Deployment pipelines let you develop and test before releasing to users (Development → Test → Production). See get started with deployment pipelines.
Considerations and limitations
You can't set a report parameter to be both Multivalue and Allow null at the same time. However, you can combine Multivalue with Allow blank. In paginated reports, a blank value is different from a null value.
Power BI Report Builder in a virtualized environment
Power BI Report Builder is fully supported on Azure Virtual Desktop and Windows 365. Running it as a virtualized application (for example, Citrix published app) isn't supported.