Note
Access to this page requires authorization. You can try signing in or changing directories.
Access to this page requires authorization. You can try changing directories.
APPLIES TO: ![]() Power BI Desktop
Power BI Desktop ![]() Power BI service
Power BI service
Power BI has several built-in samples with a report and semantic model. You can either import them into the Power BI service (https://app.powerbi.com) or download and open sample files in Power BI Desktop.

This tutorial shows you how to:
- Sign up for a Power BI license if you don't have one.
- Import the Retail Analysis sample and add it to the Power BI service.
- Explore the sample in the service.
- Create a visual by using natural language in Q&A.
- Generate quick insights based on the semantic model.
- Open the Retail Analysis sample .pbix file in Power BI Desktop.
If you'd like more background information, see Sample semantic models for Power BI. In that article you learn about how to get the samples, where to save them, and how to use them.
If you want to familiarize yourself with the built-in sample in this tutorial and its scenario, see Retail Analysis sample for Power BI: Take a tour.
Prerequisites
The prerequisites depend on whether you're using the Power BI service or Power BI Desktop.
Power BI service (app.powerbi.com)
- You need a Fabric free license to explore samples and save them to your workspace in the Power BI service. Sign up for a free trial if you don't have access.
Power BI Desktop
Tip
You don't need a Power BI license to explore the samples in Power BI Desktop.
- To open a Power BI .pbix file, you need to get Power BI Desktop. It's a free download.
- You need to download the Retail Analysis Sample .pbix file.
Import the sample in the Power BI service
Open the Power BI service (
app.powerbi.com), and select Learn in the left pane.On the Learning center page, under Sample reports, scroll by selecting the right arrow until you can select the Retail Analysis Sample.
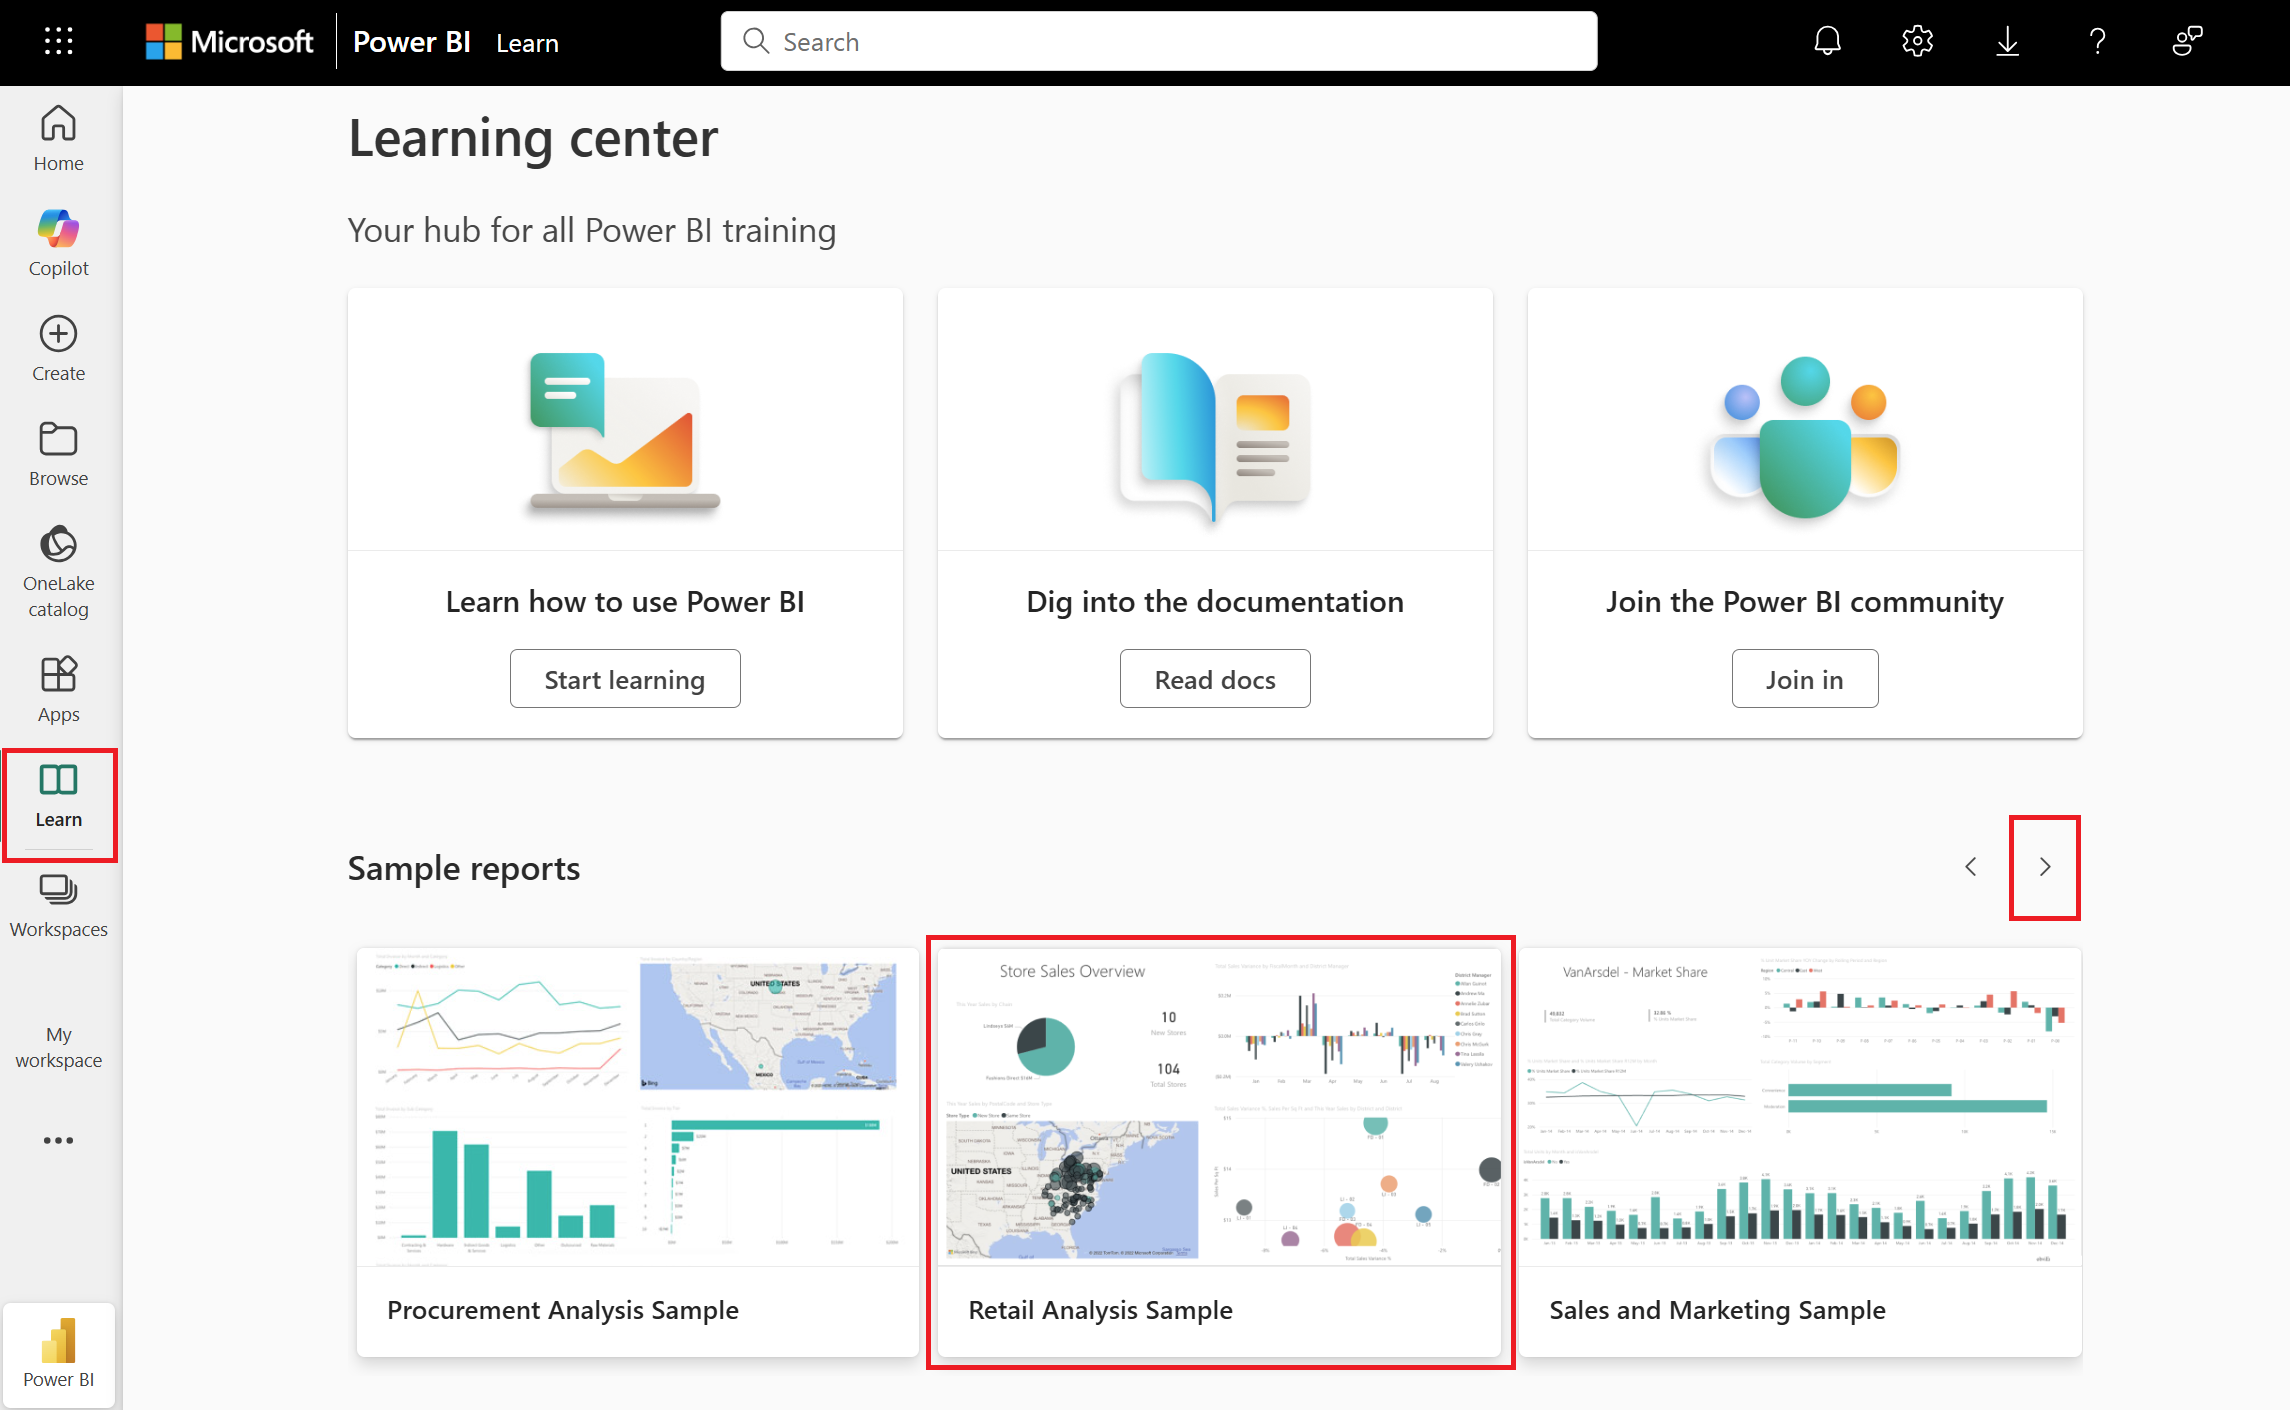
Select the Retail Analysis Sample.
Power BI imports a copy of the built-in sample in reading mode into your current workspace. After import, you see a dashboard, report, and semantic model available in your workspace.


Now let's explore the dashboard, reports, and semantic model.
Explore the dashboard
There are many different ways to navigate to your dashboards, reports, and semantic models. First, let's start from the dashboard.
See the following sections for ways to explore the sample content via the dashboard:
Besides the Q&A and report examples, dashboard tiles can be pinned from other sources. For example, a tile can be pinned from Excel. When you select the tile, Excel Online opens inside of Power BI. This tutorial doesn't have any tiles pinned from Excel.
For more information about dashboards, see Introduction to dashboards for Power BI designers.
Explore in Q&A
The Q&A feature in the Power BI service lets you explore your data in your own words, asking questions using natural language.
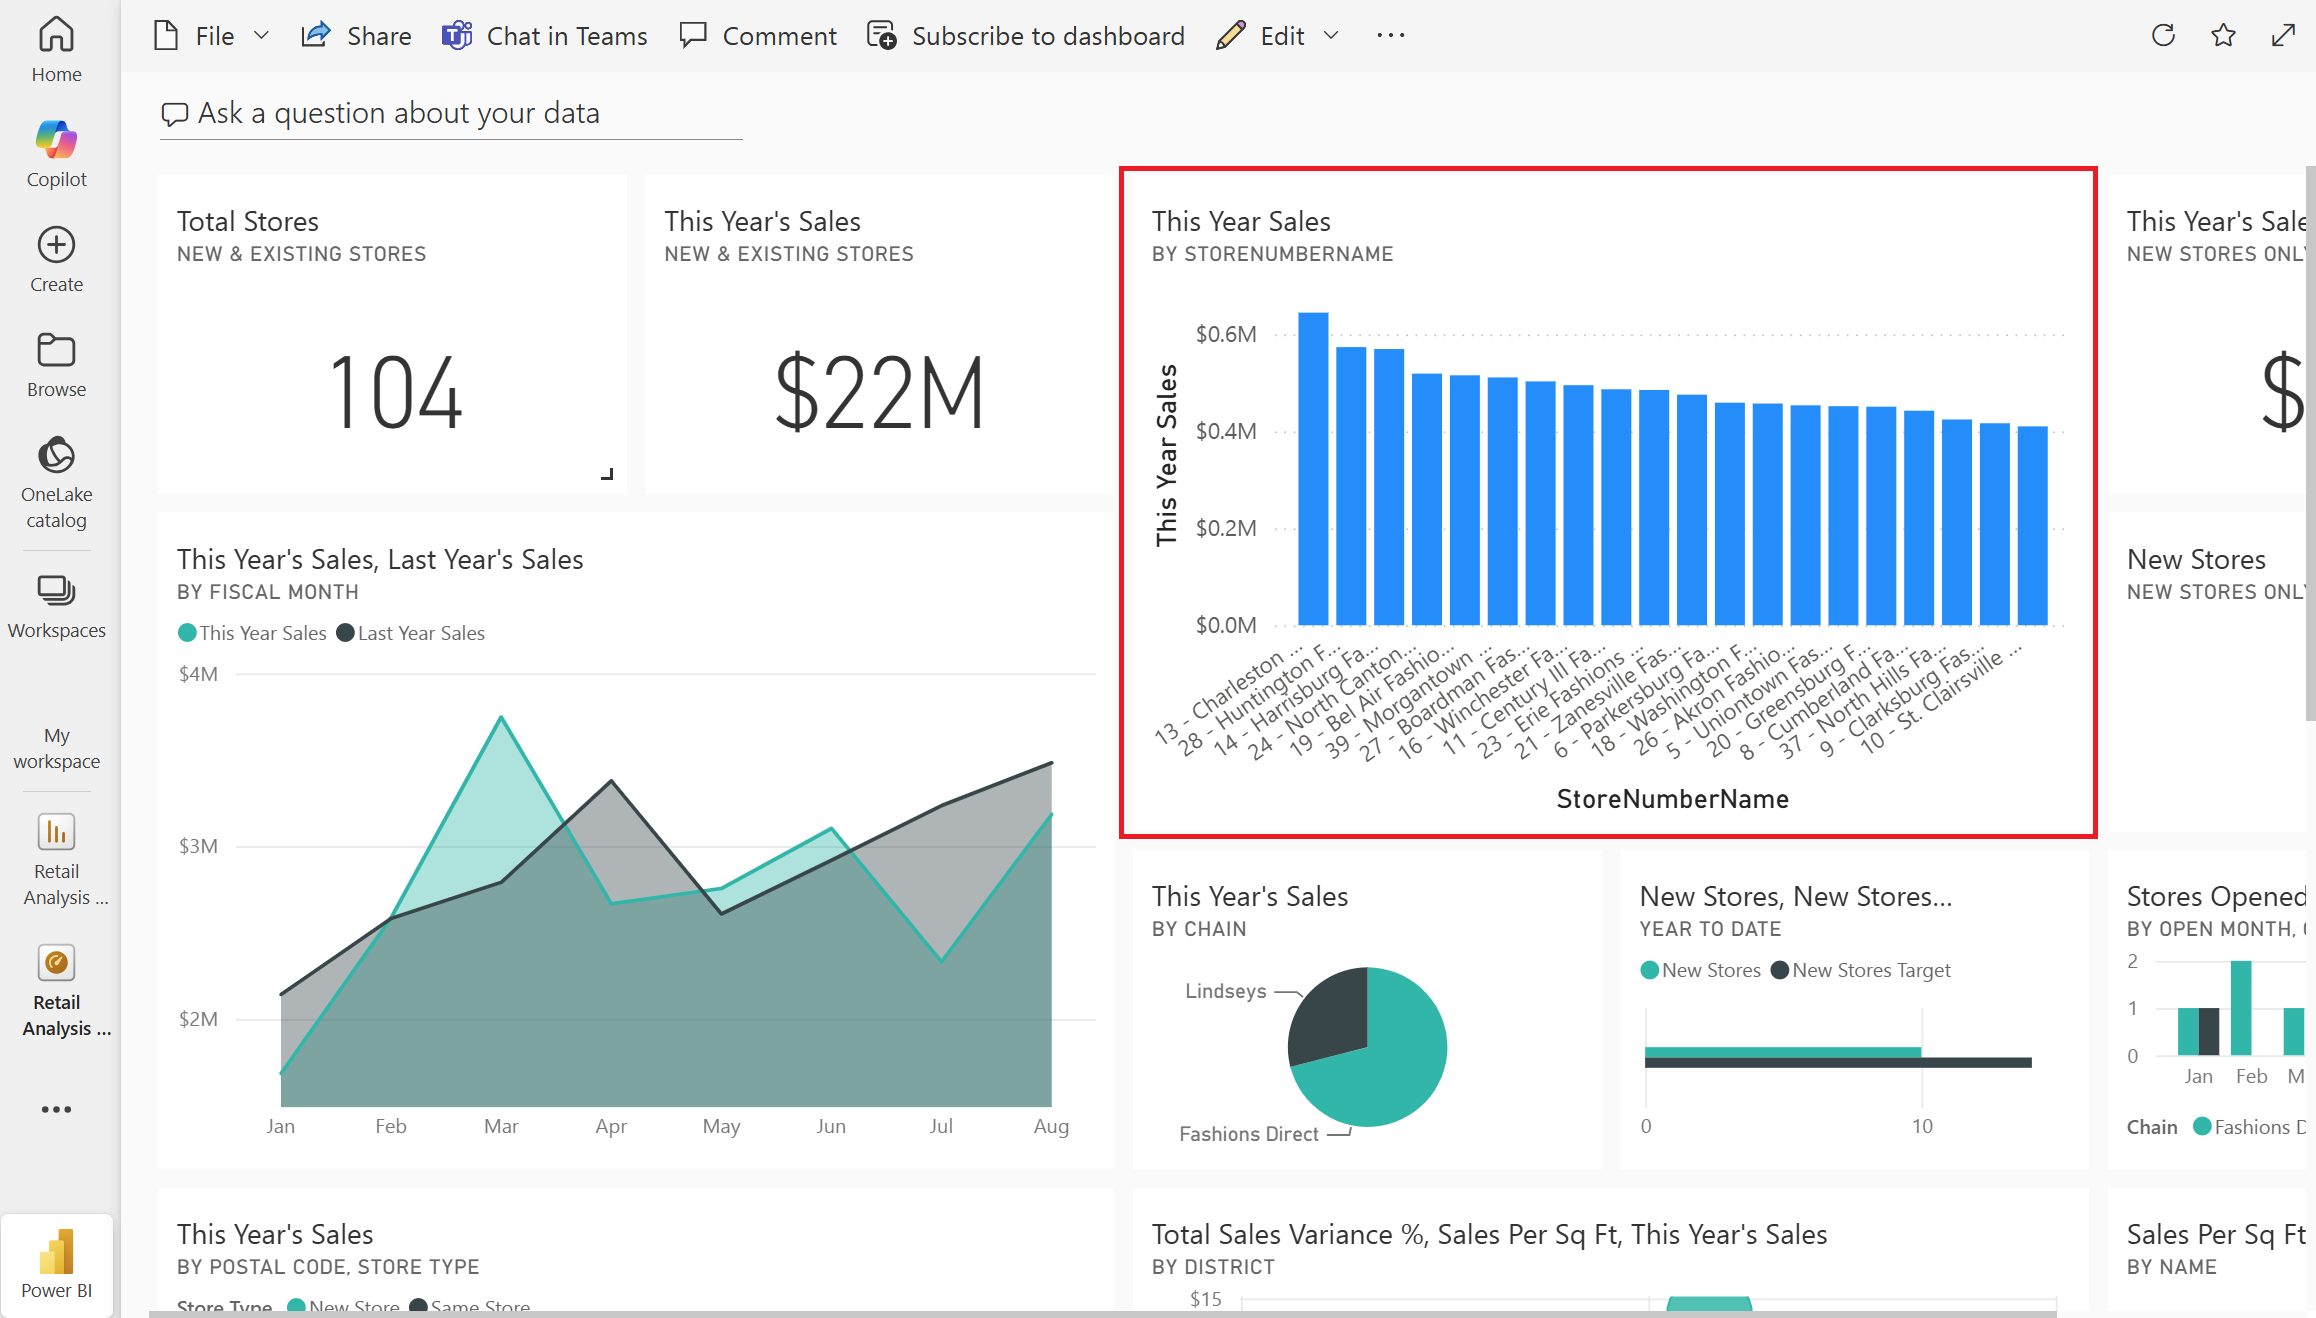
From your workspace, select the Retail Analysis Sample dashboard to open it.
The dashboard opens, with various visualization tiles.
Find the This Year's Sales, New & Existing Stores tile that displays a value of $22M.
Select the tile directly. Otherwise, select the ellipsis (...) in the upper-right corner of the tile, and then select Go to Q&A.

This tile was created and pinned to the dashboard via Power BI Q&A, so when you select the tile, you go to the Q&A page.

In the text box at the top, enter by store after this year's sales. Q&A creates a bar chart of values for each store.
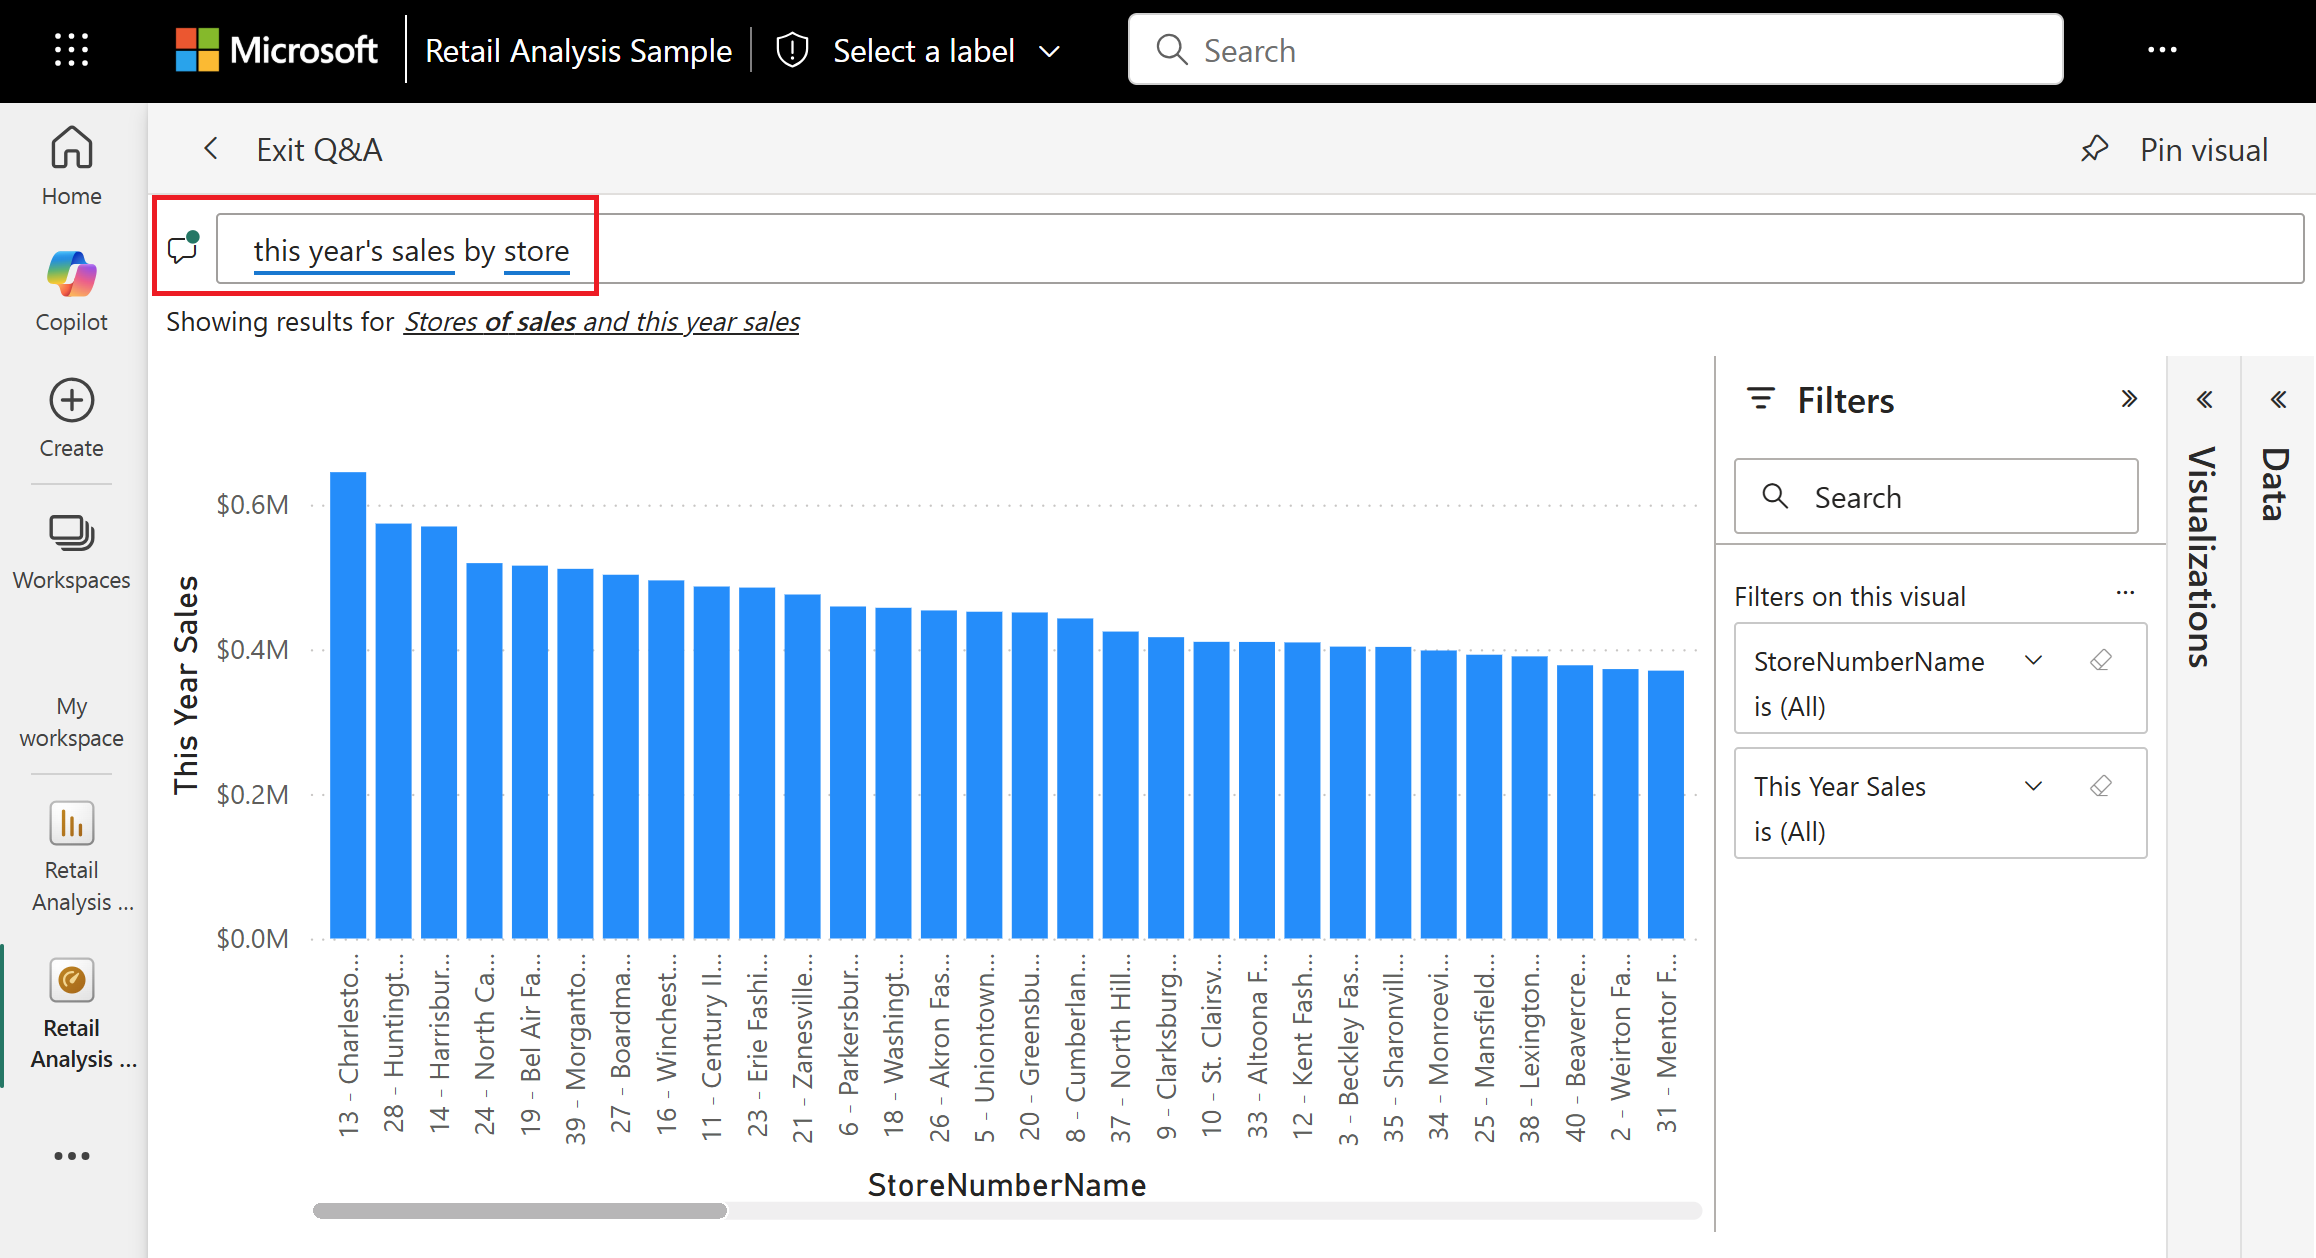
In the upper-right corner, select Pin visual.
Pin your new visual to your existing dashboard, Retail Analysis Sample.
Select Exit Q&A.
Power BI added your new tile at the end of the dashboard. You can resize it and drag it anywhere you want on the dashboard. You see how the other tiles move to make way for it.


Explore the report
If a tile was pinned from a report, the report opens when you select it.
Select one of the other tiles in the dashboard. In this example, select the area chart, This Year's Sales, Last Year's Sales by Fiscal Month. The underlying report opens.

The report opens to the page that contains the area chart you selected, in this case, the District Monthly Sales page of the report.

Check out Dive deeper into the data in the article "Retail Analysis sample for Power BI: Take a tour" for suggestions on exploring the report.


Explore the semantic model
In this tutorial, you can also explore the semantic model directly:
- Try quick insights.
- Let Power BI Auto-create a report for you.
Explore quick insights
One easy way of exploring a semantic model is to run quick insights.
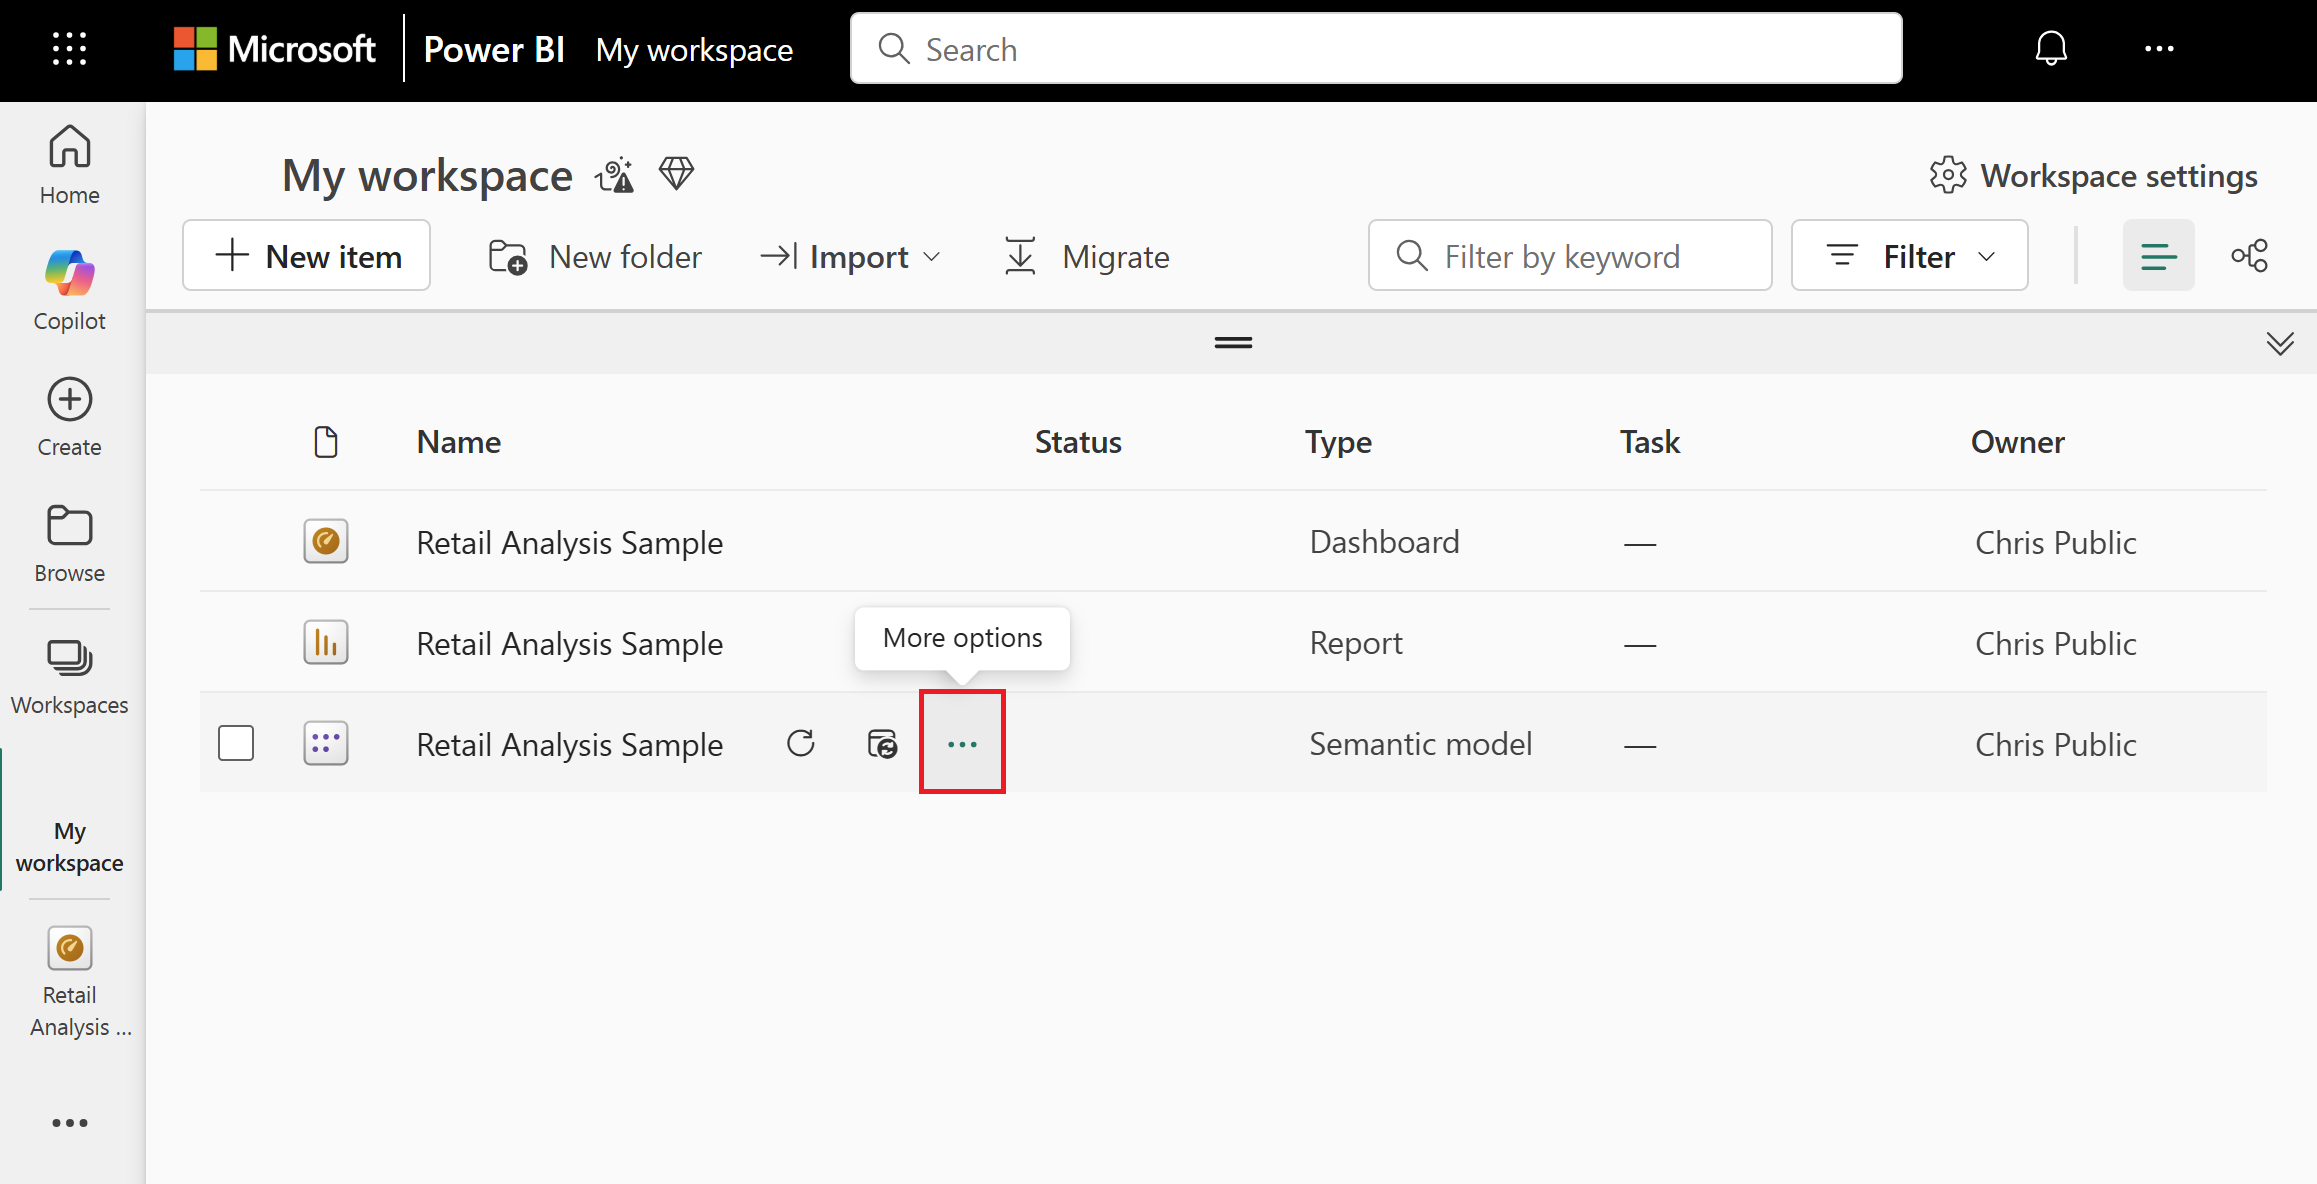
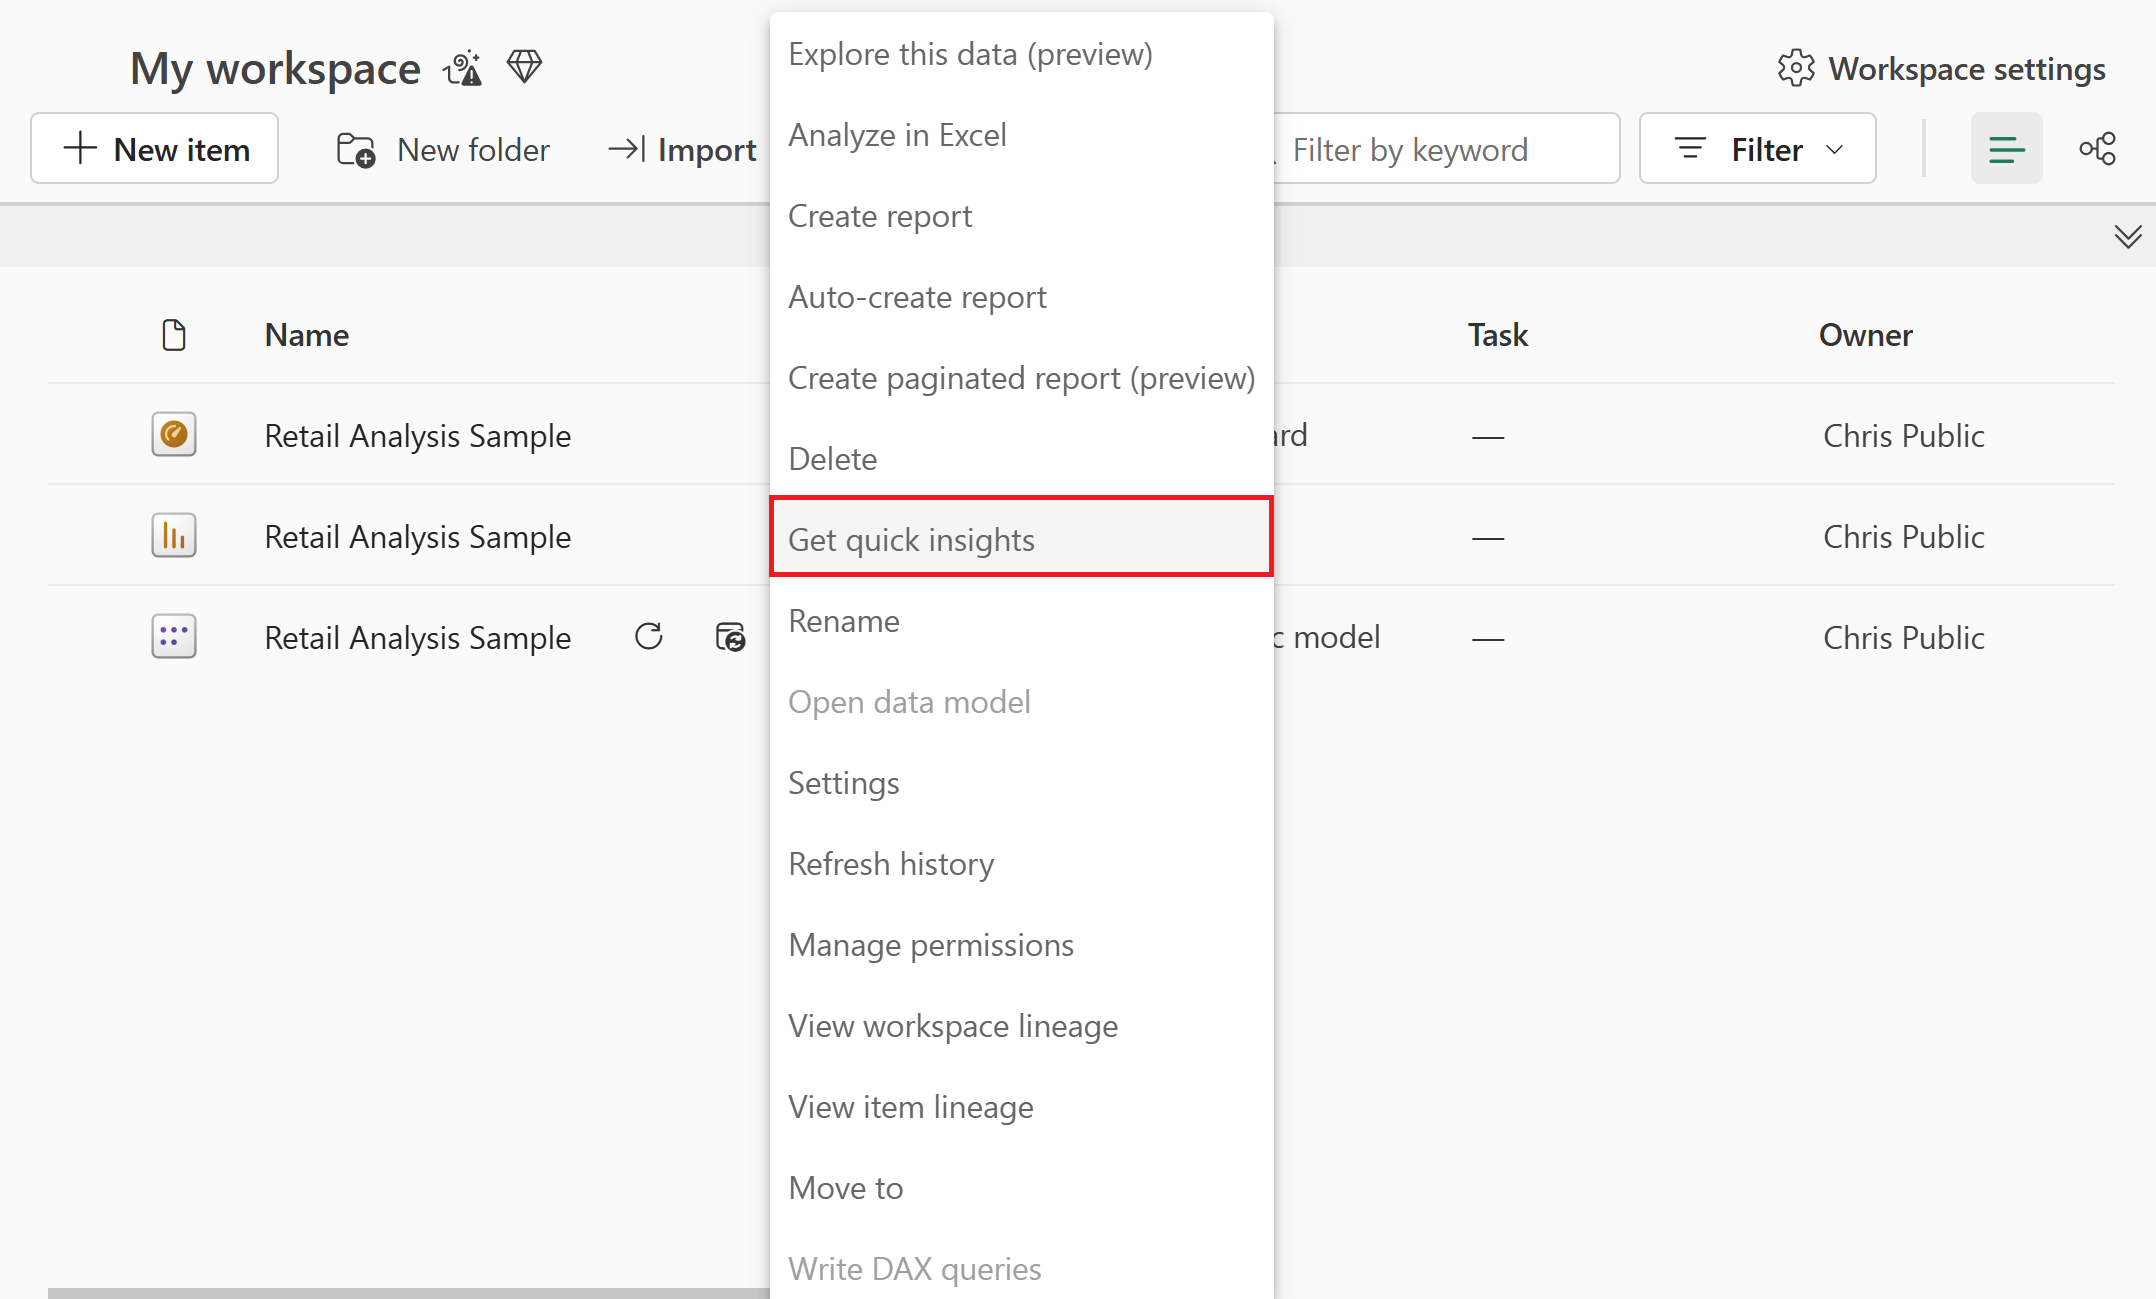
In your workspace, find the Retail Analysis Sample semantic model.
Select the ellipsis (...) for more options to explore the semantic model.
Then select Get quick insights.
When the insights are ready, select View insights from the notification dialog that appears.
Review the insights that Power BI generated.

If an insight is of interest, you can pin it to the dashboard.


Create a report from the semantic model
On the Semantic models tab, you have several options for exploring your semantic model. However, you can't view the rows and columns of your data, as you can in Power BI Desktop or Excel. One way to explore the semantic model is to create a report by using Auto-create.
To auto-create a report:
In your workspace, select the Retail Analysis Sample semantic model to open it.
From the Discover business insights pane, select Explore this data > Auto-create a report.

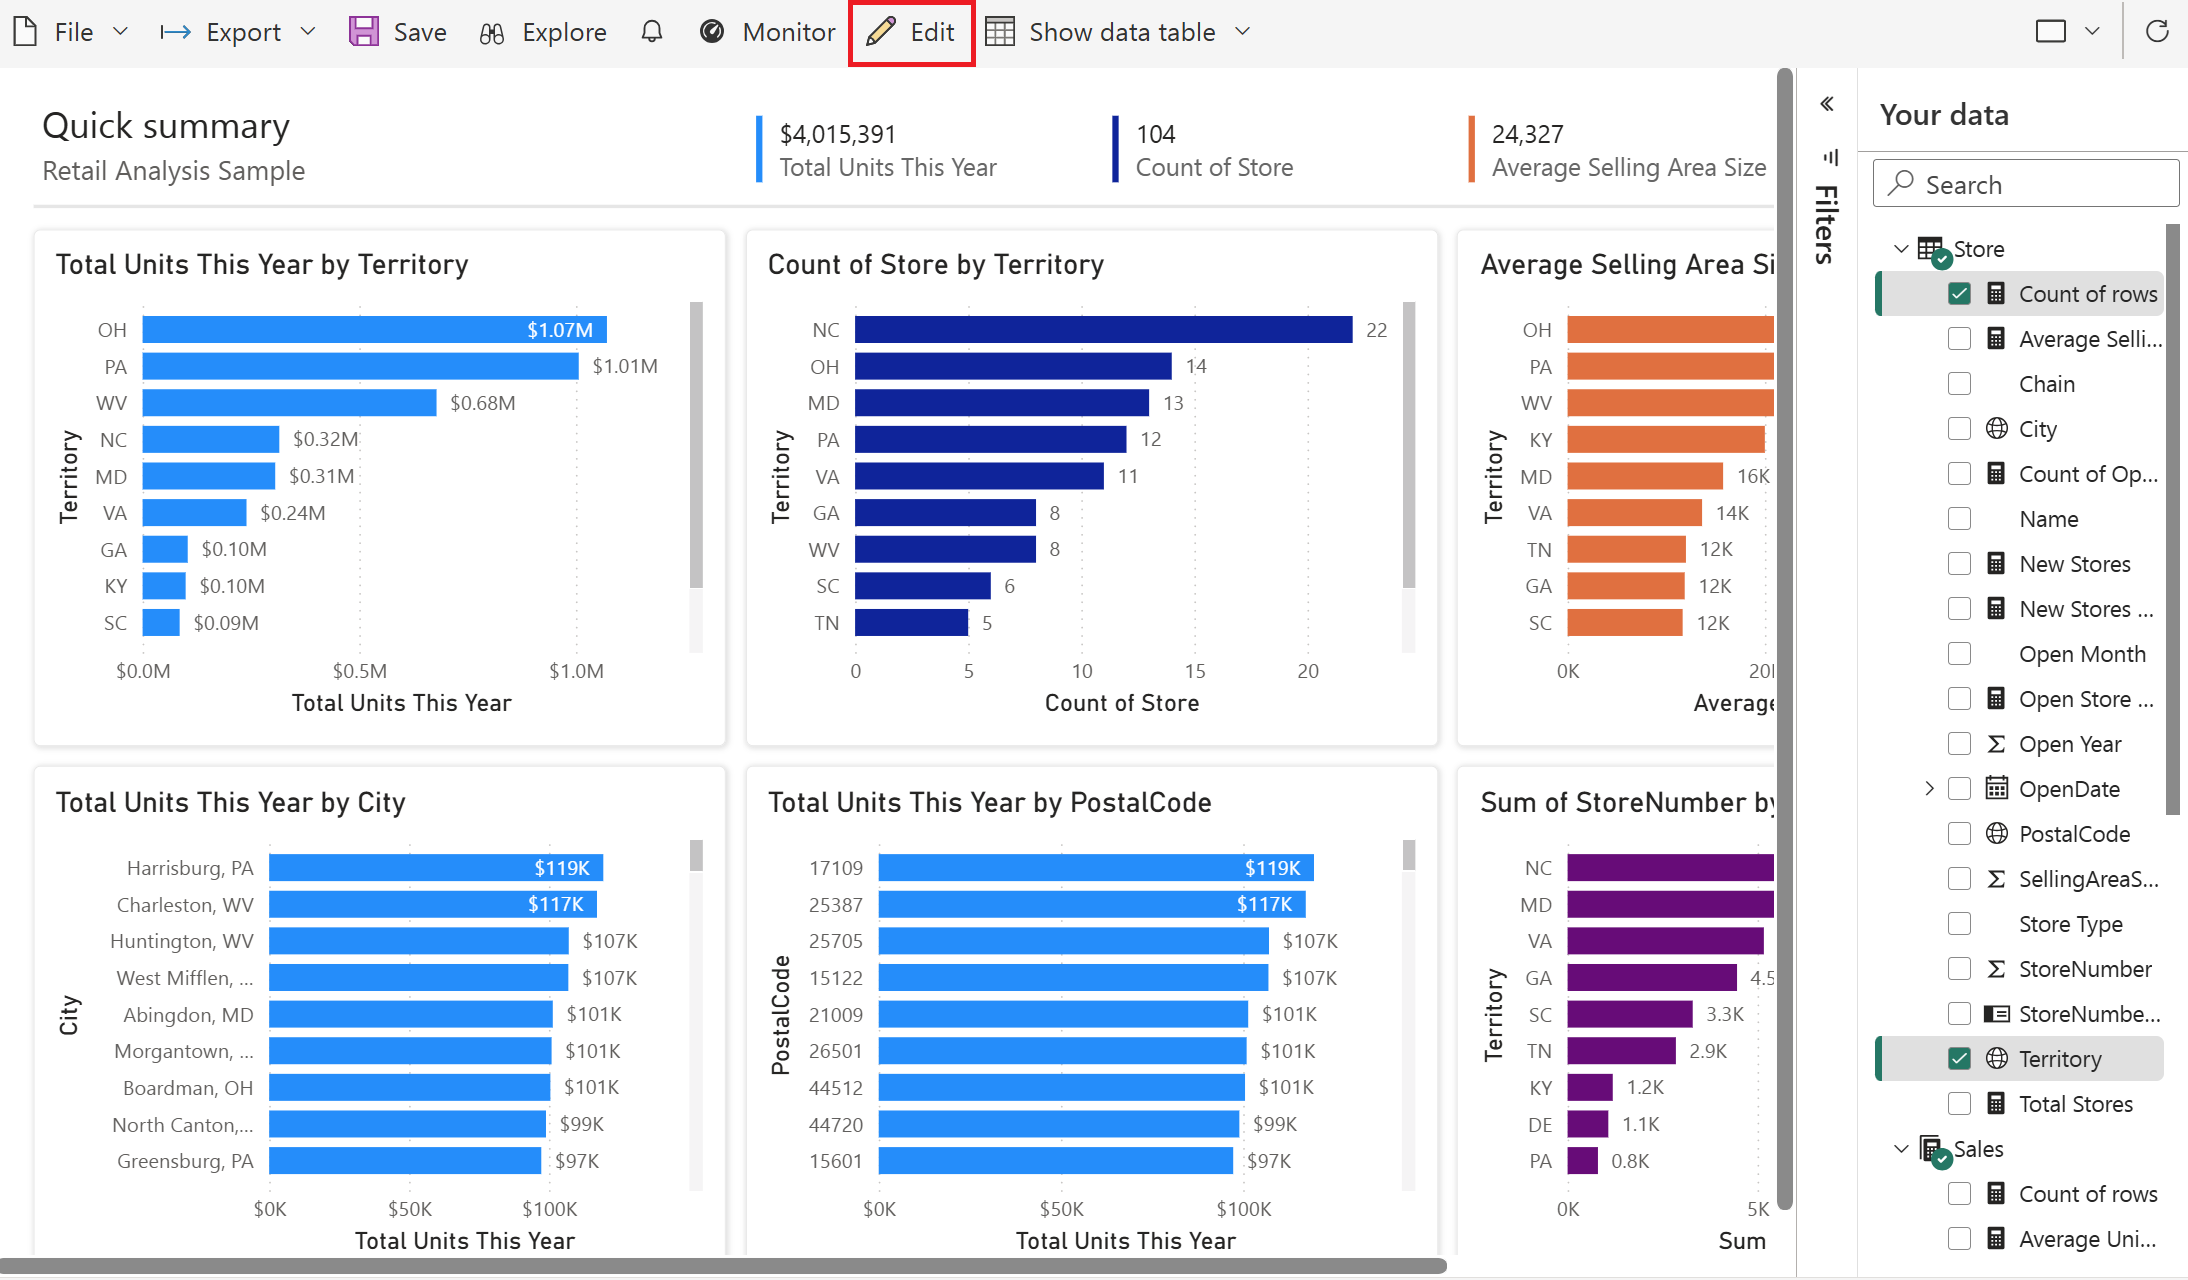
Select some data from the list of available fields. For example, under Store select Count of rows and Territory.
Select Edit to revise and improve the report.
Note
When you switch to edit mode, you lose access to Your data pane.


Download the sample in Power BI Desktop
When you first open the sample .pbix file in Power BI Desktop, it displays in Report view where you can explore and modify existing report pages and add new ones, with your own visualizations. Report view provides almost the same design experience as report Editing view in the Power BI service. You can move visualizations around, copy and paste, change the kind of visualization, and so on.
Note
You might be prompted to convert Bing Maps visuals to Azure Maps. You should upgrade because Bing Maps is being deprecated.
For a comprehensive understanding of Azure Maps, including how to get started, what data is sent to Azure, and the service's limitations, see Get started with Azure Maps Power BI visual.
Unlike editing a report in the Power BI service, in Power BI Desktop you can also work with your queries and model your data to ensure your data supports the best insights in your reports. You can then save your Power BI Desktop file wherever you like, whether it's to your local drive or to the Power BI service.
To download the sample:
Download the Retail Analysis sample .pbix file.
Open the sample Retail Analysis Sample PBIX.pbix in Power BI Desktop.

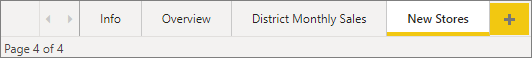
The file opens in Report view. There are four tabs at the bottom of the report editor. These tabs represent the four pages in this report.
Select the New Stores page.
For a deep dive into the report editor, see Take a tour of the report editor.

What's in your report?
The downloaded sample .pbix file includes not just a report but also the underlying semantic model. When you open the file, Power BI Desktop loads the data with its associated queries and relationships.
Note
You can view the underlying data and relationships, but you can't view the underlying queries in the Query Editor.
To view the underlying data and model:
Switch to Table view by selecting the Table view icon:


In Table view, you can inspect, explore, and understand data in your Power BI Desktop model. It's different from how you view tables, columns, and data in the Query Editor. The data in Table view is already loaded into the model.
When you're modeling your data, sometimes you want to see what's actually in the rows and columns of a table, without creating a visual on the report canvas. This fact is especially true when you're creating measures and calculated columns, or you need to identify a data type or data category.
Switch to Model view by selecting the model view icon:


Model view shows all of the tables and columns in your model, and the relationships between them. From here you can view, change, and create relationships.


Related content
This environment is a safe one to play in, because you can choose not to save your changes. But if you do save them, you can always return to the Learning center for a new copy of this sample.
This tutorial showed how Power BI dashboards, semantic models, relationships, and reports can provide insights into sample data. Now it's your turn. Connect to your own data. With Power BI, you can connect to a wide variety of data sources. To learn more, see Get started with the Power BI service and Get started with Power BI Desktop.
More questions? Try the Power BI Community