Note
Access to this page requires authorization. You can try signing in or changing directories.
Access to this page requires authorization. You can try changing directories.
The following examples demonstrate the functionality of code interpreter for handling complex prompts.
The examples assume you already:
- Enabled code interpreter in Power Platform admin center for your environment
- Created a new AI Builder prompt and turn on code interpreter in the prompt settings.
Example scenario 1: code interpreter prompt to audit transactions
The purchasing manager at Contoso regularly audits purchase transactions. They receive a periodic PDF report identifying high-risk vendors, and follow a policy requiring purchase orders for transactions of over $10,000. The purchasing manager uses the PDF to audit the transactions in Excel. The purchasing manager uses prompts with code interpreter to automate this audit process.
Edit and test the transactions prompt
With the prompt editor open and code interpreter turned on, follow these steps to create the prompt:
Enter the following instructions for the prompt:
1. You are given:
-An Excel file <parameter A> with thousands of procurement transactions, including vendor name, invoice amount, PO number, and transaction date.
-A PDF file <parameter B> listing vendors flagged as "High Risk" in the latest compliance audit.

2. Your tasks:
-Process the Excel file to identify:
-Transactions over $10,000 with missing or blank PO numbers.
-Extract vendor names from the PDF file that are marked "High Risk".
-Cross-reference the vendor names in Excel with those from the PDF file.
-Flag transactions that meet either of the following criteria:
  -High-value transaction with missing PO
  -Vendor is classified as High Risk
-For each flagged transaction:
  -Highlight the row in red
  -Add a comment explaining the issue (for example, "High Risk Vendor" or "PO Missing")

3. Generate a summary report listing:
-Total flagged transactions
-Vendor names involved
-Reasons for flagging

4. Return:
-The updated Excel file with highlights and comments
-A summary audit report formatted as PDF
-A summary of updates made in text
In the instructions, replace
<parameter A>with a file input parameter for the Excel file that contains procurement transactions. To make the change, replace the text with/and select Image or document from the context menu. Provide a name for this parameter such as "procurement transactions," and upload a sample Excel file with transactions using the expected format.Make sure to have transaction ID, vendor name, invoice amount, PO number, and transaction date as columns in the transaction file. You can use another prompt with code interpreter turned on to create this sample Excel file as needed.
Follow the same steps to replace the text
<parameter B>with an uploaded input PDF document for the vendor risk report. You can have vendor names as a list in the PDF file. Again, you can use another prompt with code interpreter turned on to create the sample PDF file as needed.Select Test.
In a few seconds, you should see the summary output in text as the model response.
Note
You can leave the default model as GPT-4o or select any other as needed.
Under Model response > Output, select Document for the model response format. The model response should also show the updated Excel file with flagged transactions and the summary report in PDF format. You can download these files to verify the results.
Important
To retest with a different file, you have to change the prompt text and save. Simply uploading or swapping the sample file without modifying the prompt doesn't trigger reprocessing.
This example illustrates the power of code interpreter enabling prompts to perform complex scenarios using files.
Example scenario 2: code interpreter prompt to create a visual summary of Dataverse tables
This example shows how to create a prompt with code interpreter turned on to read records from Dataverse tables, analyze the data, and generate a visual summary (chart) and a text summary.
Edit and test the Dataverse prompt
With the prompt editor open and code interpreter turned on, follow these steps to create the prompt:
Enter the following instructions for the prompt:
1. You are given:
- Ticket data that gives the created date/time, first response date/time, and the first response SLA date/time:

2. Your tasks:
- Create a histogram of the tickets by day of the week created and show the first response SLA status
- Create insights into trends in the data

3. Return:
- A graph. Make sure to return the graph as a base64 encoded image
- A summary of insights
Ground the prompt by linking to relevant Dataverse tables (for example, tickets, staff schedules).
Use
/to open the input and knowledge menu and select Dataverse under Knowledge.
Select a table and select necessary fields (for example, ticket status, assigned agent, SLA status) to the prompt.
Select Add to add the fields from the table to the prompt.

Select Filter attribute, as needed, to filter the table data on specific attributes and values.

Select Test to run the prompt.
Verify that the prompt reads ticket data, applies assignment rules, and updates records in Dataverse as expected.

Save the prompt.
Integrate the prompt into an agent flow in Copilot Studio
Next, you can create an agent flow to wrap the prompt and connect it to Dataverse.
Return to the Tools page for the agent and select Add a tool > New tool > Agent flow.
The agent flow designer appears with an initial When an agent calls the flow trigger.
In the designer, select Insert > Run a prompt to add a new Run a prompt action.

In the Run a prompt node, select your code interpreter prompt.
In the designer, select Insert > Respond to the agent to add a new Respond to the agent action after the Run a prompt action.
Next, open the Respond to the agent node editor to select parameters to pass back to the agent as outputs.
Use Add an output to add the summary text and the graph image data from the prompt as outputs for the flow.
Name one of the outputs
Summary, and use the dynamic value option to select theInsightsoutput variable from the Run a prompt action.Name the second output
GraphBase64, and define the output value using the expression option. Select the Base64 image output from the Run a prompt action.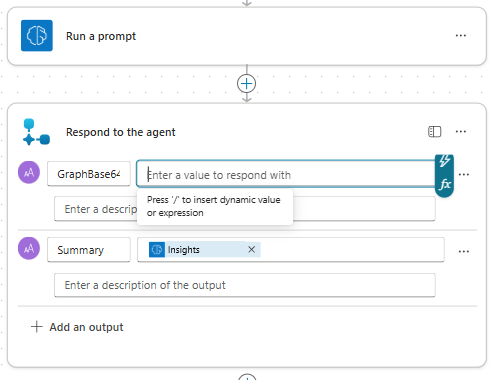
Select Save draft.
On the Overview tab, under Details, give the flow a name.
Publish and use the agent
Save and publish the agent.
The agent can now process Dataverse records and generate a summary and chart.
Go to the agent Tools page and select the specific agent flow that uses the prompt.
Under Completion, set the After running action to Send an adaptive card (specify below).
Under Adaptive card to display using a PowerFx formula, select Formula to define the card using a formula.
The adaptive card formula editor appears.
Define the contents and source for the adaptive card using the following formula:
{
  "$schema": "http://adaptivecards.io/schemas/adaptive-card.json",
  "type": "AdaptiveCard",
  "version": "1.0",
  "body": [
    {
      "type": "Image",
      "url": "data:image/png;base64," & Topic.Output.GraphBase64,
      "altText": "Ticket analysis generated graph"
    },
    {
      "type": "TextBlock",
      "text": Topic.Output.Summary,
      "wrap": true
    }
  ]
}
Here,
Topic.Output.GraphBase64andTopic.Output.Summaryare the output variables defined earlier for the agent flow.Save your agent and test it.
Publish your agent so that other users can generate dynamic content based on the Dataverse tables.
Example scenario 3: code interpreter prompt to create a chart from a user-supplied Excel file
This example shows how to create a prompt with code interpreter turned on to read an uploaded Excel file, convert the data into a chart image, and return the image to the user. The prompt is triggered from a topic when the user uploads an Excel file and asks for a chart.
Create and configure the chart generation prompt
With the prompt editor open and code interpreter enabled, follow these steps to create a prompt:
Give your prompt a meaningful name (for example, Image gen prompt), and enter the following instructions for the prompt:
Read the attached Excel (.xlsx) and convert it into a chart named mychart.png.Use
/to open the input and knowledge menu and select Image or document under Input.Select an Excel file with sample data to upload as the document input for testing.
Select Save.
Select Add to agent to add the prompt as a tool.
Create a topic that calls the chart prompt
Go to the Topics tab in Copilot Studio and create a new topic by selecting Add a topic > From blank.
Under the Trigger note, set Describe what the topic does to "When a file is uploaded and the user says 'generate my chart.'"
Select Add node, and then select Variable management > List management > Loop through a list to add a loop node.
Select the Loop through a list node to open the node editor. Under Items to loop over, select Select variable > System > Activity.Attachments.

Within the loop, select Add node, and then select Add a tool and select the prompt you created earlier to add the prompt tool to the topic.
Configure input and output variables accordingly. For the input, set using a formula to
Topic.LoopValue1.Valueand select Insert. For the output, initialize a variable namedOutputto capture the prompt output.
Within the loop, select Add node > Create a message to add a message node. The message node is used to relay the prompt output back to the user. In this example, the prompt initializes the variable
Outputwith the response. The text is stored inOutput.text.In the text portion of the message, select Insert variable and select
Output.text.Select Add > Image to add an image to the message.

Next, format to display the image correctly. Select Media and under Image URL, select Select variable > Formula, and enter the following formula:
"data:" & Topic.Output.artifacts.mychart.mimeType & ";base64," & Topic.Output.artifacts.mychart.base64ContentNote
This format is required in order for the chat to render the image correctly. In this example,
mychartrepresents the name we selected for the file output in our prompt andOutputis the variable name. The details can change in other examples depending on how the prompt output and topic variables are named.
Select Save to save your topic.
Select Test. You should see an image displayed when the prompt is triggered.

More examples of prompts using code interpreter
The following table provides more examples of prompts that can be used with code interpreter turned on. These examples show how to prompt code interpreter to perform complex tasks.
| Prompt | Expected result |
|---|---|
| Create a PDF file to capture order details | Generate an order capture form in PDF form |
| Create a copy of the PDF file <parameter A> | Create a copy of the provided PDF file input. |
| Create an Excel file with a synthetic data set of sales transactions | Create an Excel file with sample sales transaction. You can improve on the performance by giving more instructions in the prompt to get more advanced synthetic data generated. The next example shows a more complex prompt. |
| Create an Excel file with a realistic synthetic dataset simulating weekly sales transactions across four regions ("North," "South," "East," "West") for a full calendar year. Each record should include: - Date of transaction (weekly) - Region - Salesperson Name (at least three unique names per region) - Product Category (for example, "Electronics," "Furniture," "Appliances", "Clothing") - Product Name (realistic names based on category) - Units Sold - Unit Price (varies by category) - Total Sale Amount (calculated) - Target Met (Yes/No, based on a regional threshold) - Quarter - Channel (Online, Retail, Distributor) - Customer Segment (for example, "Enterprise," "SMB," "Consumer") Inject some random variation and seasonality: - Boost sales for "Electronics" in Q4 - Lower sales in "North" during Jan–Feb (simulate winter slowdown) - Higher clothing sales in Q2 (spring) The final dataset should be at least 2,000 rows. Add light randomness for realism. |
This prompt generates an Excel file with richer synthetic data than before. This prompt illustrates the effectiveness of code interpreter and how we should give clear and detailed instructions in the prompt. |
| Autocreate Summary Sheet – using <parameter A> Generate: - Monthly rollups - Top-performing regions - Conditional formatting for underperformers |
Perform analysis of an Excel file by passing the file as the input into this prompt. This prompt creates the summary in Excel but, can be saved into a PDF file as well by prompting accordingly. |
| Highlight cells in green color if sales > 1000 else, make it red | Ask the code interpreter to perform Excel formatting based on conditions and formulas. The formatting is expressed in the prompt as illustrated. You can apply the same idea to other use cases in Excel formatting/style handling. |