Note
Access to this page requires authorization. You can try signing in or changing directories.
Access to this page requires authorization. You can try changing directories.
Understanding how devices in your organization contribute to the user's experience is critical to any digital transformation effort. To help you understand this aspect, the Microsoft Adoption Score includes endpoint analytics information. The Endpoint analytics page in Microsoft Adoption Score shares organizational level insights with roles outside of Microsoft Intune. The visibility and insights provided in areas like device boot times and application reliability can help your users by highlighting potential issues within your organization. For instance, endpoint analytics can expose a long sign-in process or issues with applications unexpectedly stopping.
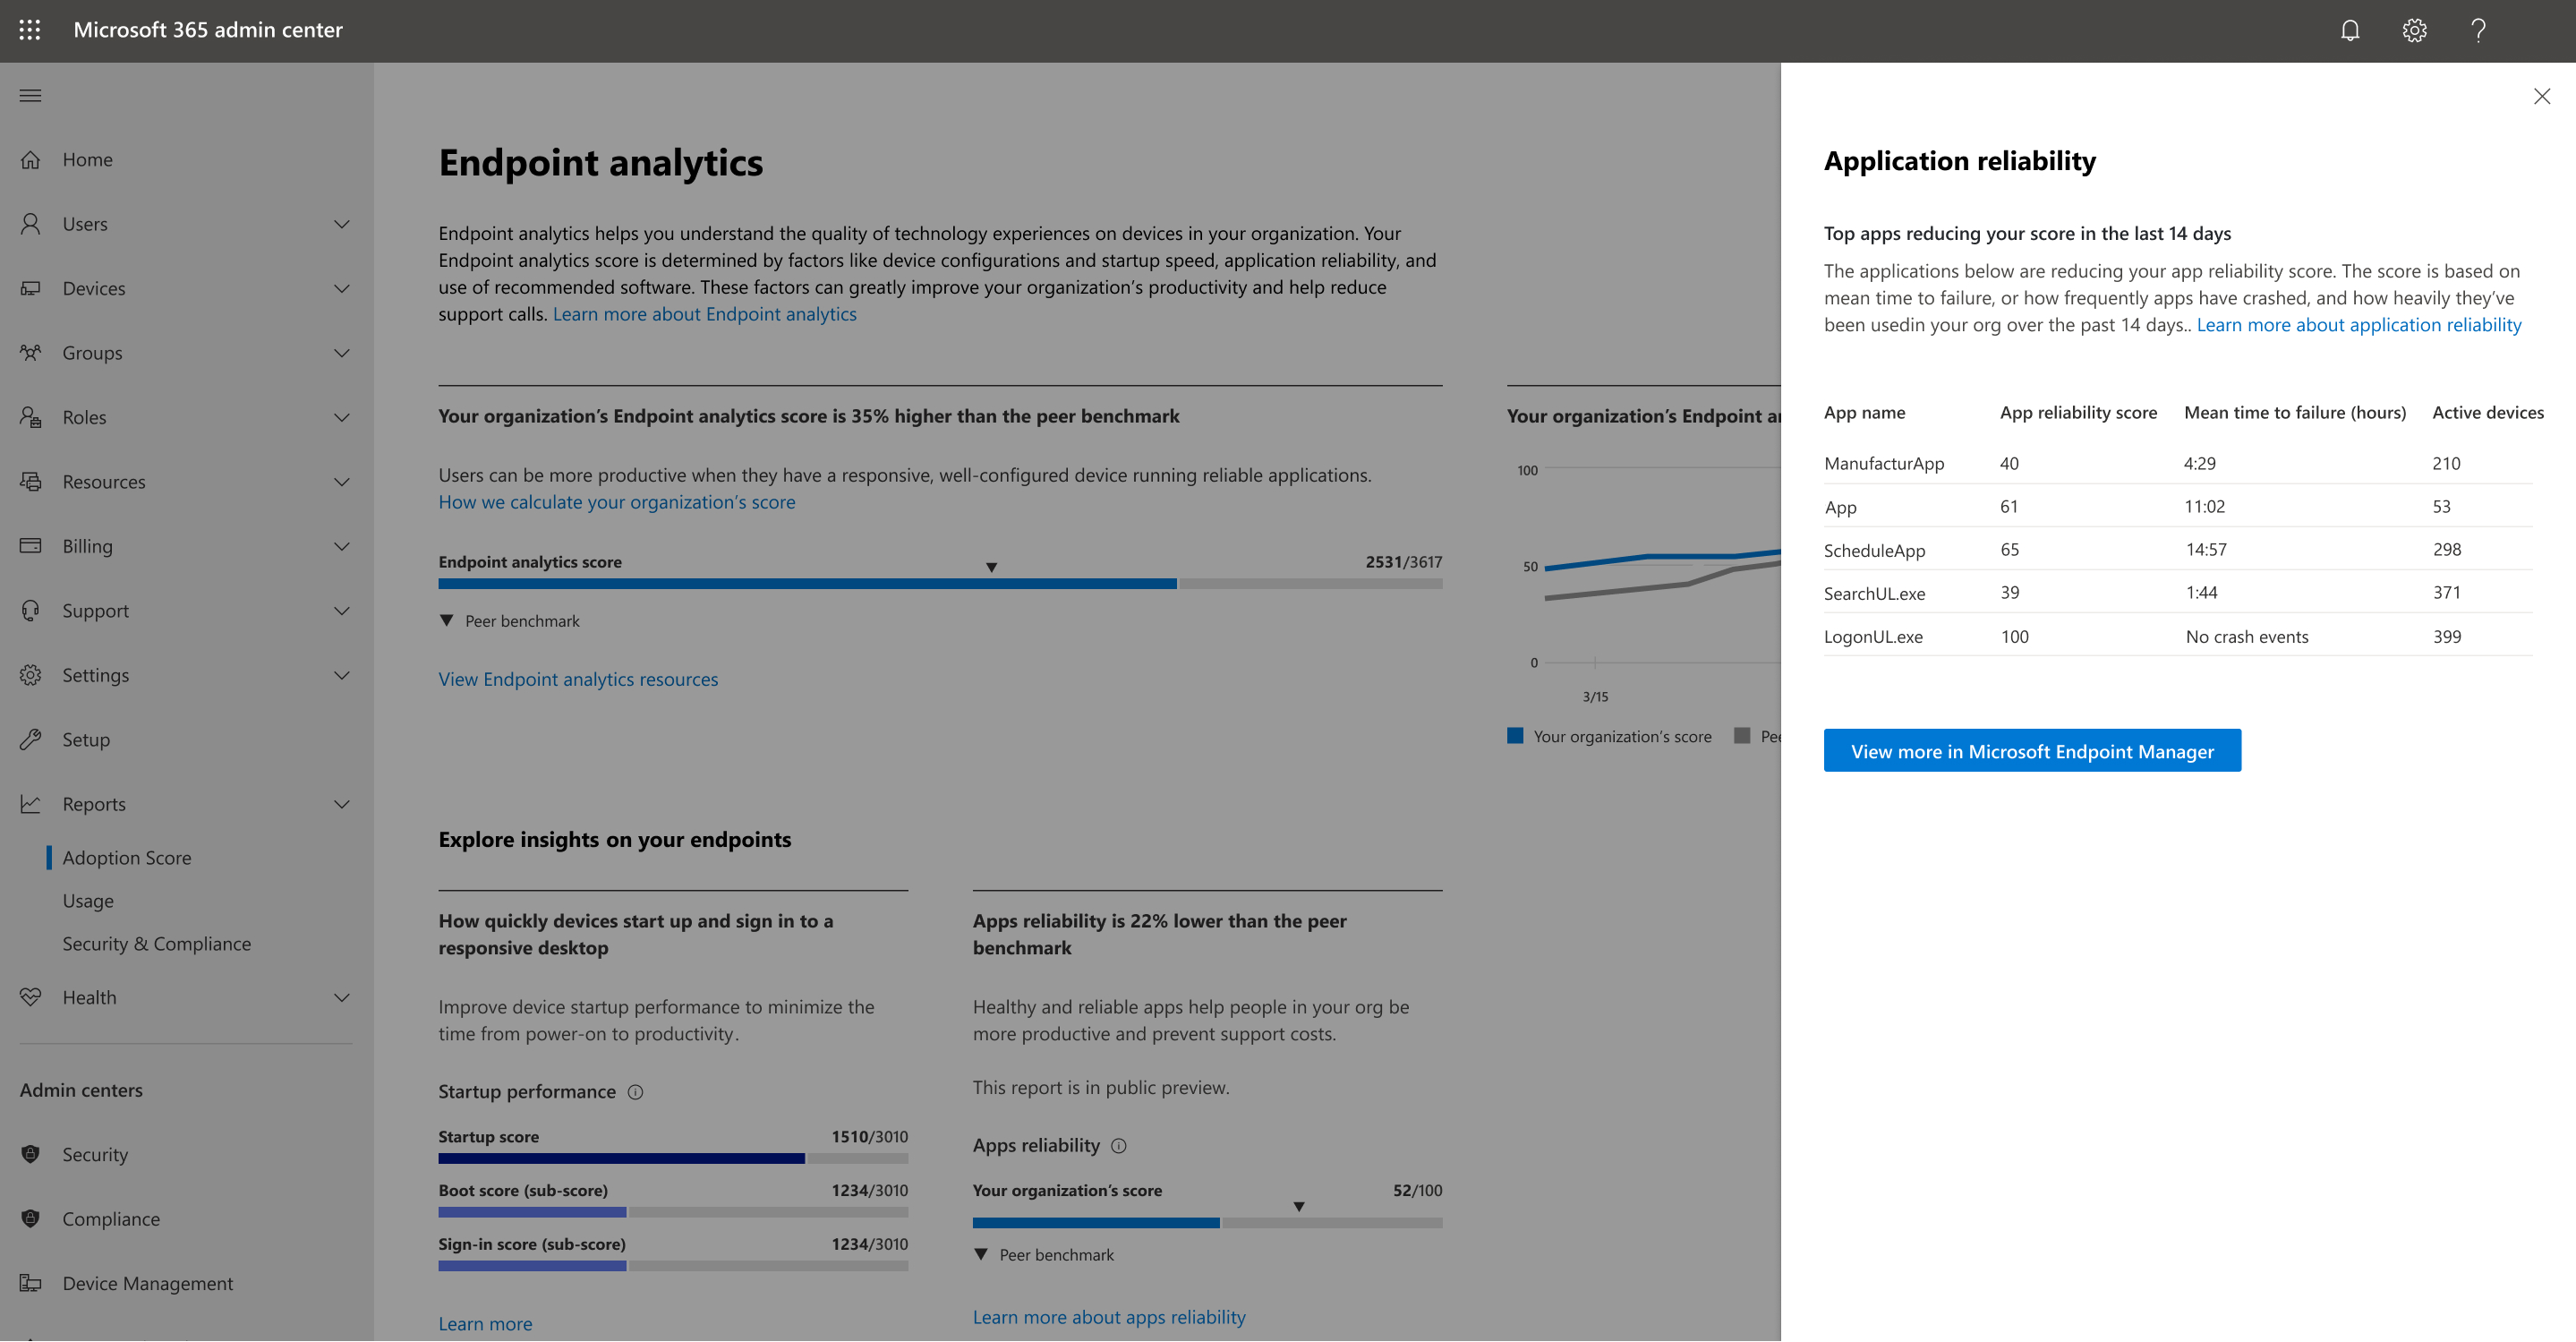
Endpoint analytics page in the Adoption Score report
Endpoint analytics contains great insights, but it requires access to the Microsoft Intune admin center. If you're an Intune Administrator, you can display the analytics. However, other users of Microsoft Adoption Score might be unaware this information exists. Displaying these insights to Microsoft Adoption Score users allows them to use the data to help drive transformation efforts across your organization.
The Endpoint analytics page looks similar to the other pages in Adoption Score, making it easy to dive right in. The following information is displayed on the Endpoint analytics page:
- The current endpoint analytics score
- Endpoint analytics score over the past 180 days
- Startup performance scores
About the endpoint analytics scores
The endpoint analytics score is a weighted average of the Startup performance, Application reliability, and Work from anywhere scores.
Startup performance metrics
Select the Learn more link under the startup performance information to get more details and a link to View more in Microsoft Intune. The Startup performance metrics are averages of the following items:
Average device startup time in seconds
- Total boot time: The combination of the Group Policy phase and the Time to sign-in prompt
- Group Policy phase: The time spent querying and processing Group Policy
- Time to sign-in prompt: Boot time minus the time spent processing Group Policy
Average sign-in time in seconds
- Total sign-in time: Total time for the Group Policy phase, Time to desktop, and Time to responsive desktop
- Group Policy phase: The time spent querying and processing Group Policy
- Time to desktop: The time it takes to reach the desktop but where background processes are still running, and users experience slower performance
- Time to responsive desktop: Time where background processes are complete and CPU utilization is less than 50%
Application reliability metrics
The chart shows the overall Application reliability score for your tenant with the peer benchmark. Select the Learn more about app reliability link under the app reliability information to get more details and a link to View more in Microsoft Intune. The following Application reliability information comes from Microsoft Adoption Score:
- Top apps reducing your score in the last 14 days
- App name: The app identifier in the file manifest provided by your client devices. The app name is typically in executable (or .exe) format.
- App reliability score: A score between 0 and 100 that represents the relative reliability of the application in your tenant. This score is calculated based on Mean time to failure and Total usage duration (14 days). A score of 0 represents an unreliable app that likely hampers end-user productivity. A score of 100 represents a reliable app that likely contributes to end-user productivity.
- Mean time to failure in hours: The average amount of engagement time that an end user is able to use the application before a crash occurs over the past 14 days. This value is calculated by dividing Total usage duration (14 days) by Total crashes (14 days). By relating usage duration and crash counts, the frequency of crashes across different applications is normalized. Applications without crash events in your tenant over the past 14 days are given a mean time to failure value of
No crash events. - Active devices: The total number of your tenant's enrolled devices that launched this app at least once in the past 14 days.


