Note
Access to this page requires authorization. You can try signing in or changing directories.
Access to this page requires authorization. You can try changing directories.
In this article, you learn to read data, metadata, and evaluate measures in semantic models using the SemPy Python library in Microsoft Fabric. You also learn to write data that semantic models can consume.
Prerequisites
Get a Microsoft Fabric subscription. Or, sign up for a free Microsoft Fabric trial.
Sign in to Microsoft Fabric.
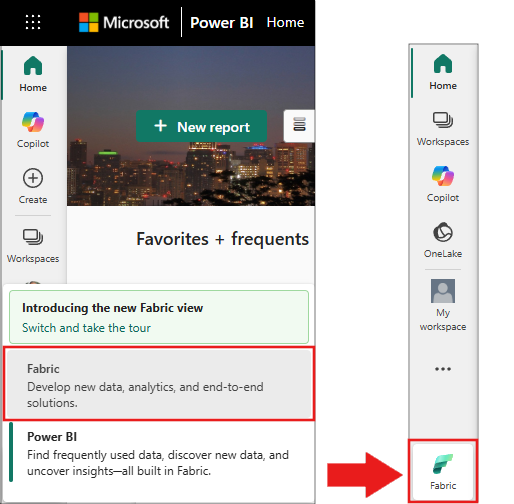
Use the experience switcher on the bottom left side of your home page to switch to Fabric.
- Go to the Data Science experience in Microsoft Fabric.
- Create a new notebook to copy and paste code into cells.
- For Spark 3.4 and above, Semantic link is available in the default runtime when using Fabric, and there's no need to install it. If you're using Spark 3.3 or below, or if you want to update to the most recent version of Semantic Link, you can run the command:
python %pip install -U semantic-link - Add a Lakehouse to your notebook
- Download the Customer Profitability Sample.pbix semantic model from the datasets folder of the fabric-samples repository and save it locally.
Upload the semantic model into your workspace
This article uses the Customer Profitability Sample.pbix semantic model. The semantic model references a company that manufactures marketing materials. It includes product, customer, and revenue data for different business units.
- Open your workspace in Fabric Data Science.
- Select Import > Report, Paginated Report, or Workbook > From this computer, and select the Customer Profitability Sample.pbix semantic model.

After the upload is complete, your workspace includes three new artifacts: a Power BI report, a dashboard, and a semantic model named Customer Profitability Sample. The steps in this article rely on this semantic model.

Use Python to read data from semantic models
The SemPy Python API can retrieve data and metadata from semantic models located in a Microsoft Fabric workspace. The API can also execute queries on them.
Your notebook, Power BI dataset semantic model, and lakehouse can be located in the same workspace or in different workspaces. By default, SemPy tries to access your semantic model from:
- The workspace of your lakehouse, if you attached a lakehouse to your notebook.
- The workspace of your notebook, if there's no lakehouse attached.
If your semantic model isn't located in either of these workspaces, you must specify the workspace of your semantic model when you call a SemPy method.
To read data from semantic models, follow these steps:
List the available semantic models in your workspace.
import sempy.fabric as fabric

df_datasets = fabric.list_datasets()
df_datasets
List the tables available in the Customer Profitability Sample semantic model.
df_tables = fabric.list_tables("Customer Profitability Sample", include_columns=True)
df_tables
List the measures defined in the Customer Profitability Sample semantic model.
Tip
In the following code sample, we specified the workspace for SemPy to use for accessing the semantic model. You can replace
<Your Workspace>with the name of the workspace where you uploaded the semantic model (from the Upload the semantic model into your workspace section).df_measures = fabric.list_measures("Customer Profitability Sample", workspace="<Your Workspace>") df_measuresHere, we determined that the Customer table is the table of interest.
Read the Customer table from the Customer Profitability Sample semantic model.
df_table = fabric.read_table("Customer Profitability Sample", "Customer")
df_table
Note
- Data is retrieved using XMLA, which requires at least XMLA read-only to be enabled.
- The amount of retrievable data is limited by: - The maximum memory per query of the capacity SKU that hosts the semantic model. - The Spark driver node (visit node sizes for more information) that runs the notebook.
- All requests use low priority to minimize the impact on Microsoft Azure Analysis Services performance and are billed as interactive requests.
Evaluate the Total Revenue measure for the state and date of each customer.
df_measure = fabric.evaluate_measure(
    "Customer Profitability Sample",
    "Total Revenue",
    ["'Customer'[State]", "Calendar[Date]"])
df_measure
Note
- By default, data is not retrieved using XMLA, so XMLA read-only doesn't need to be enabled.
- The data isn't subject to Power BI backend limitations.
- The amount of retrievable data is limited by: - The maximum memory per query of the capacity SKU hosting the semantic model. - The Spark driver node (visit node sizes for more information) that runs the notebook.
- All requests are billed as interactive requests.
- The
evaluate_daxfunction doesn't auto-refresh the semantic model. Visit this page for more details.
To add filters to the measure calculation, specify a list of permissible values for a particular column.
filters = {
    "State[Region]": ["East", "Central"],
    "State[State]": ["FLORIDA", "NEW YORK"]
}
df_measure = fabric.evaluate_measure(
    "Customer Profitability Sample",
    "Total Revenue",
    ["Customer[State]", "Calendar[Date]"],
    filters=filters)
df_measure
Evaluate the Total Revenue measure per customer's state and date with a DAX query.
df_dax = fabric.evaluate_dax(
    "Customer Profitability Sample",
    """
    EVALUATE SUMMARIZECOLUMNS(
        'State'[Region],
        'Calendar'[Date].[Year],
        'Calendar'[Date].[Month],
        "Total Revenue",
        CALCULATE([Total Revenue]))
    """)
Note
- Data is retrieved using XMLA and therefore requires at least XMLA read-only to be enabled
- The amount of retrievable data is limited by the available memory in Microsoft Azure Analysis Services and the Spark driver node (visit node sizes for more information)
- All requests use low priority to minimize the impact on Analysis Services performance and are billed as interactive requests
Use the
%%daxcell magic to evaluate the same DAX query, without the need to import the library. Run this cell to load%%daxcell magic:%load_ext sempyThe workspace parameter is optional. It follows the same rules as the workspace parameter of the
evaluate_daxfunction.The cell magic also supports access of Python variables with the
{variable_name}syntax. To use a curly brace in the DAX query, escape it with another curly brace (example:EVALUATE {{1}}).%%dax "Customer Profitability Sample" -w "<Your Workspace>" EVALUATE SUMMARIZECOLUMNS( 'State'[Region], 'Calendar'[Date].[Year], 'Calendar'[Date].[Month], "Total Revenue", CALCULATE([Total Revenue]))The resulting FabricDataFrame is available via the
_variable. That variable captures the output of the last executed cell.df_dax = _ df_dax.head()You can add measures to data retrieved from external sources. This approach combines three tasks:
- It resolves column names to Power BI dimensions
- It defines group by columns
- It filters the measure Any column names that can't be resolved within the given semantic model are ignored (visit the supported DAX syntax resource for more information).
from sempy.fabric import FabricDataFrame

df = FabricDataFrame({
        "Sales Agent": ["Agent 1", "Agent 1", "Agent 2"],
        "Customer[Country/Region]": ["US", "GB", "US"],
        "Industry[Industry]": ["Services", "CPG", "Manufacturing"],
    }
)

joined_df = df.add_measure("Total Revenue", dataset="Customer Profitability Sample")
joined_df
Special parameters
The SemPy read_table and evaluate_measure methods have more parameters that are useful for manipulating the output. These parameters include:
pandas_convert_dtypes: If set toTrue, pandas casts the resulting DataFrame columns to the best possible dtype. Learn more in convert_dtypes. If this parameter is turned off, type incompatibility issues between columns of related tables might occur. The Power BI model might not detect these issues due to DAX implicit type conversion.
SemPy read_table also uses the model information that Power BI provides.
multiindex_hierarchies: If set toTrue, it converts Power BI hierarchies to a pandas MultiIndex structure.
Write data consumable by semantic models
Spark tables added to a Lakehouse are automatically added to the corresponding default semantic model. This article demonstrates how to write data to the attached Lakehouse. The FabricDataFrame accepts the same input data as Pandas dataframes.
from sempy.fabric import FabricDataFrame

df_forecast = FabricDataFrame({'ForecastedRevenue': [1, 2, 3]})

df_forecast.to_lakehouse_table("ForecastTable")
With Power BI, the ForecastTable table can be added to a composite semantic model that includes the Lakehouse semantic model.