Note
Access to this page requires authorization. You can try signing in or changing directories.
Access to this page requires authorization. You can try changing directories.
Application usage analytics gives IT admins actionable insights into their organization's app use by analyzing traffic patterns, data usage, and which users access the app. With these analytics, admins can identify shadow IT, generative AI apps, and potential security or compliance risks. Usage analytics helps organizations increase visibility, improve their security posture, and optimize app use across their environment.
Insights and Analytics dashboard
The Insights and Analytics dashboard has three widgets:
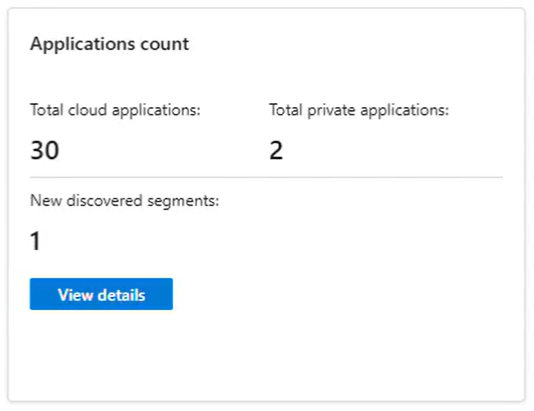
Applications count
This widget shows the Total cloud applications, Total private applications, and the number of New discovered segments used within the selected time. To learn more about discovered segments, select the View details button to open the Application discovery page.
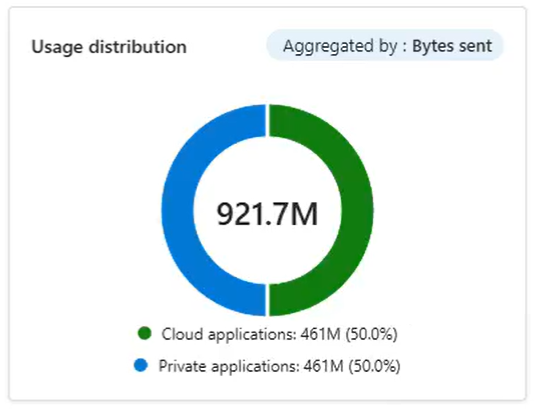
Usage distribution
This widget shows application usage by type, with one color for cloud and another for private applications in the selected time range. You can aggregate the view by Transactions, Bytes sent, or Bytes received.
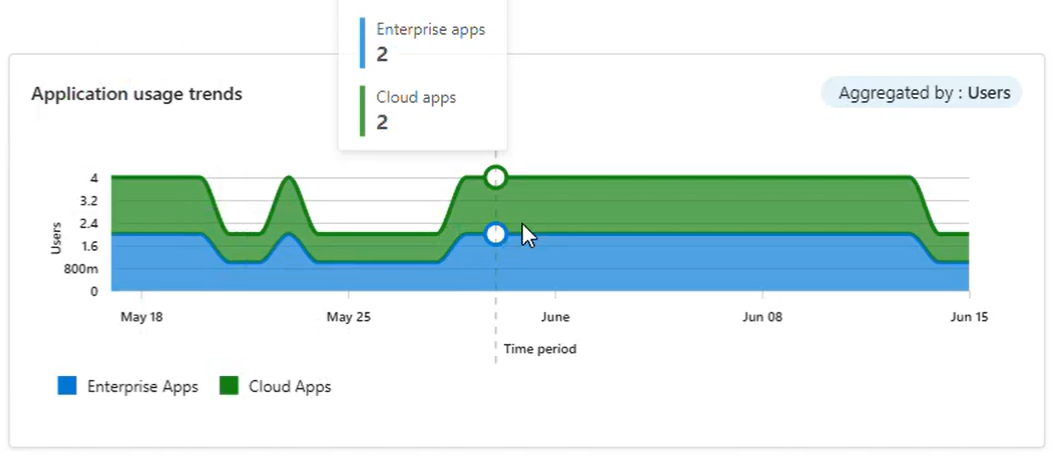
Application usage trends
This widget shows application usage over time, with one trend for cloud and another for private applications. You can aggregate the view by Transactions, Users, Devices, Bytes sent, or Bytes received.
Private application analytics
Private application analytics gives IT admins visibility and insights into their organization's private enterprise applications onboarded to Microsoft Entra by Global Secure Access. These insights include the application name, application ID, users who access the application, devices used, access type, number of transactions, traffic (bytes sent and received), and the first and last access times. Private application analytics also tracks quick access for customers who configured it.
Key capabilities
With private application analytics, you can:
- Identify the private applications that users access. Details include Application name, Application ID, Traffic type, Access type, the number of Users, Devices, and Transactions, Sent bytes, Received bytes, Last access date, and First access date.

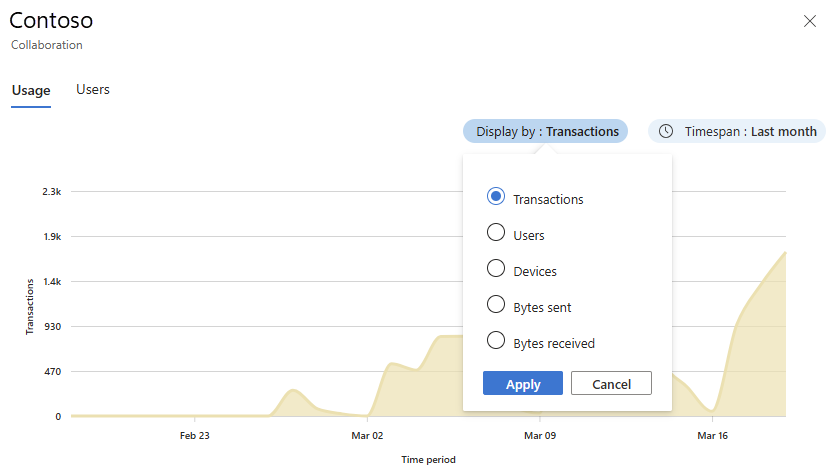
Select each private application row to open a per-app insight panel with two tabs:
The Usage tab shows a graph with usage information, including insights into the number of transactions, the amount of traffic, and the number of users accessing the applications.
The Users tab shows statistics about the usage of an application segment and which users are accessing it.

Cloud application analytics
Cloud application analytics give admins visibility and insights into the cloud applications their organization uses, including generative AI applications. These insights include the application category, risk score, number of transactions, traffic (bytes sent and received), and the users who access the applications.
This information helps admins identify generative AI applications, shadow AI applications, and shadow IT. Insights from the analytics help admins make decisions based on security and compliance status.
Key capabilities
With Cloud application analytics, you can:
Identify the cloud applications that users access (using the Microsoft Defender for Cloud Apps Cloud app catalog), for both internet and Microsoft 365 traffic. Details include Name, Category, Risk score, the number of Users, Sent bytes, Received bytes, Last access date, and First access date.

Use the Generative AI apps only toggle to identify the generative AI applications that users access, for both internet and Microsoft 365 traffic.

Select each cloud application row to view a per-app insight panel across two tabs:
The Usage tab shows a graph with usage information, including the number of transactions, the amount of traffic, and the number of users who access the applications.
The Users tab shows statistics about the usage of an application segment and which users access it.