Note
Access to this page requires authorization. You can try signing in or changing directories.
Access to this page requires authorization. You can try changing directories.
[This article is prerelease documentation and is subject to change.]
Generative insights offers detailed insights calculated using AI models. It currently supports two metrics: seasonality and signal correlation. The system clusters forecast data based on distinct patterns found for each metric.
Visual displays make it easy for planners to understand time series data and make business decisions based on it. Information is clustered (grouped) according to the detected patterns. For each cluster, generative insights provides a confidence score and describes the pattern in natural language. The system also indicates the proportion of planning items that follow the pattern.
Important
- This is a production-ready preview feature.
- Production-ready previews are subject to supplemental terms of use.
To view generative insights, follow these steps:
Open the time series that you want to analyze. For example, on the navigation pane, select Planning data > Forecasts, and then select a time series.
The Generative insights section appears near the top of the page. Do one of the following steps:
- If you've never generated insights for the current time series, then select the Generate insights button available here. The system then runs the AI model to generate insights for the current time series. The process might take a few minutes, depending on the size of the time series.
- If you have generated insights for the current time series, then summarized results are already shown. There's also a Regenerate button to regenerate the insights, which is useful if you've updated the time series since the last time you generated insights for it.
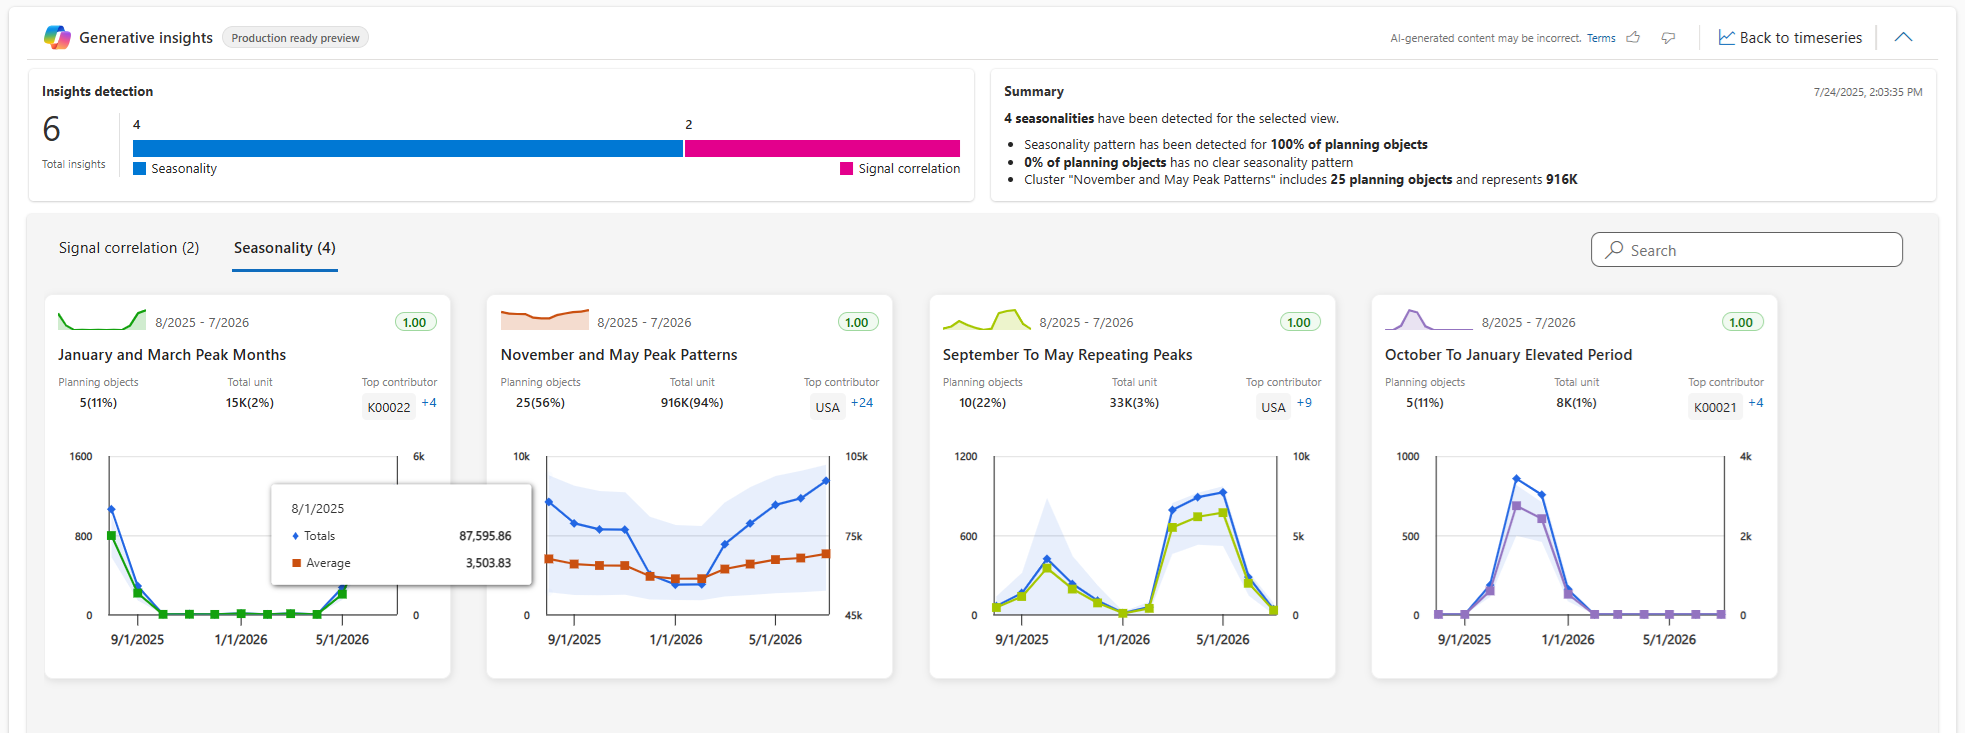
When insights are available, they are summarized in the Generative insights section (you might need to expand the section to see them). There are two tiles here:
- Insights detection – Shows how many of each type of insight was detected in the time series.
- Summary – Summarizes the insights that were detected.
In the Insight detection tile, select View insights to see the details. Depending on what was detected, the system shows one or more of the following:
- Several graphs of relevant data, with tabs that organize the data by insight type (Signal correlation and Seasonality). Select a tab to view insights of the indicated type.
- A confidence score that indicates how confident the system is about each detected insight.
- Various relevant KPI values for each insight.
- A description of each insight, which is written in natural language. This description typically explains the detected pattern and its significance.
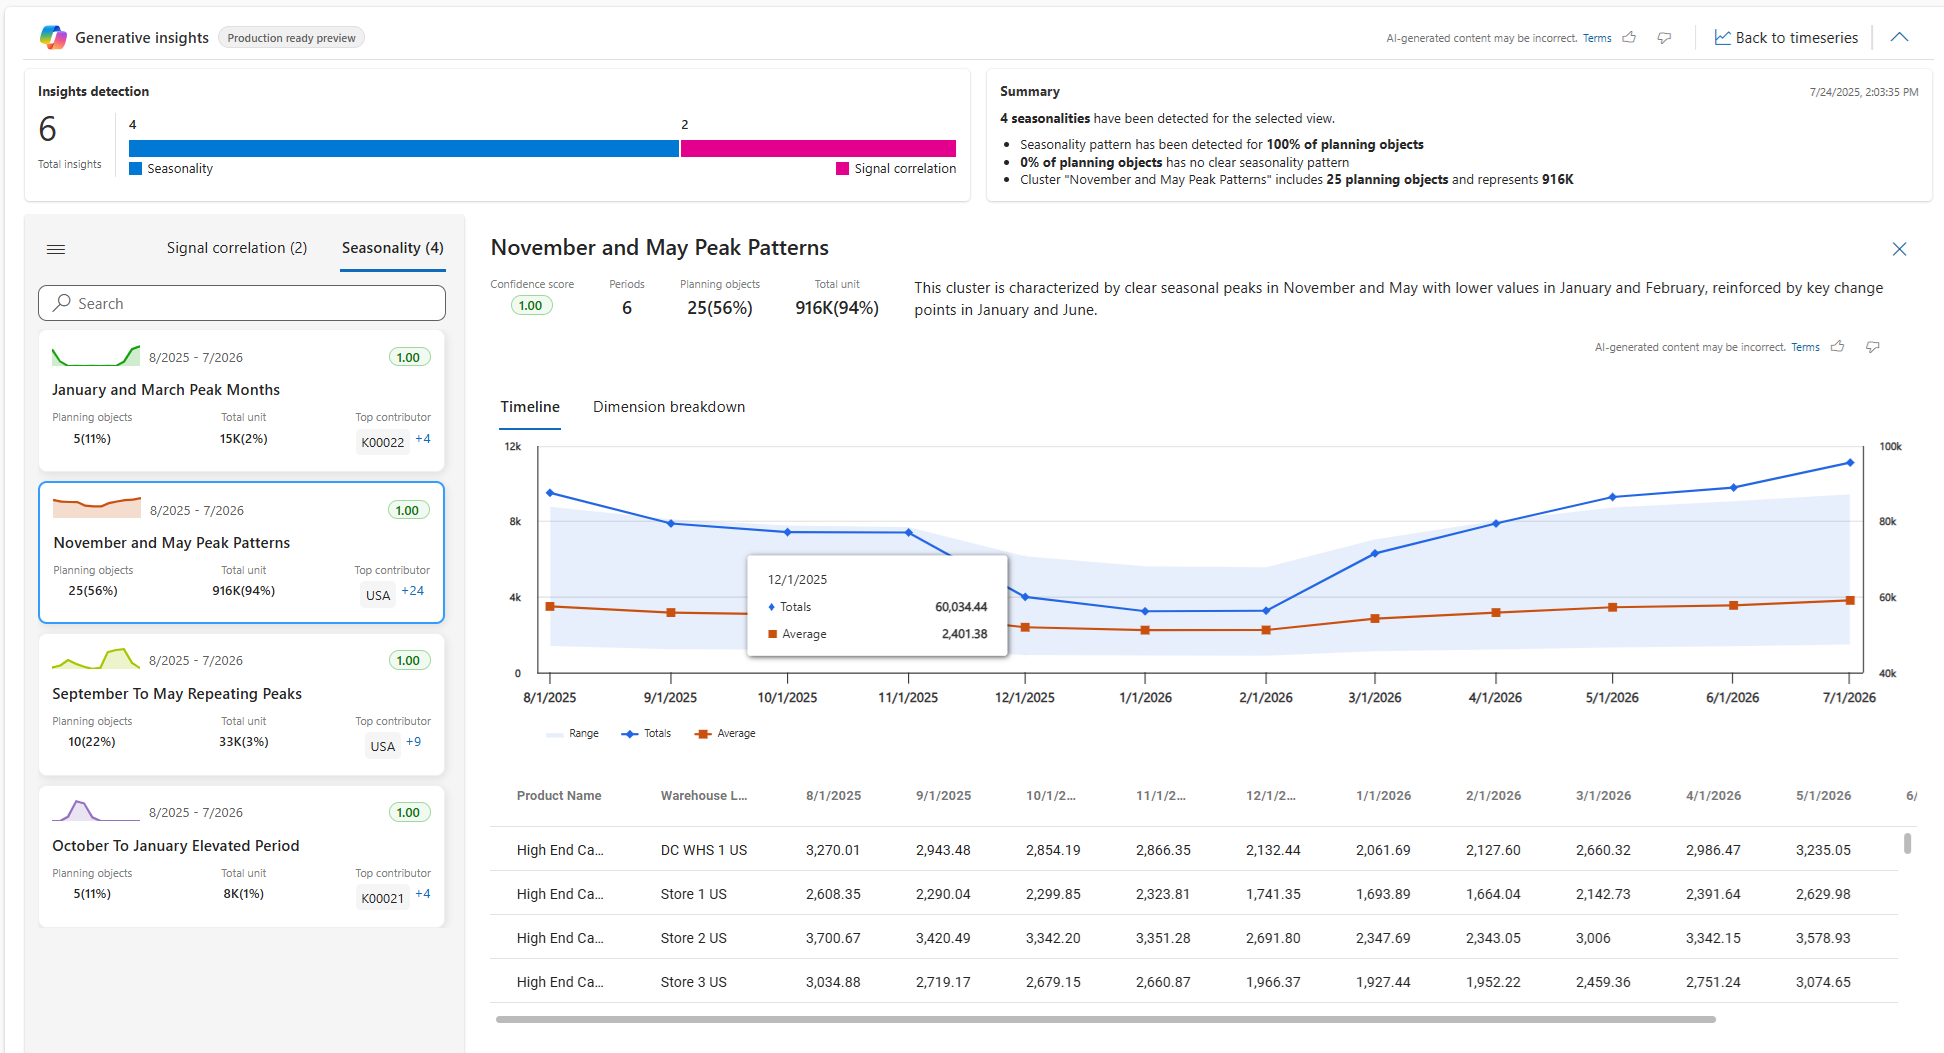
Select a graph on the Signal correlation or Seasonality tab to view even more details about it.
- Some detailed graphs provide both a timeline view and data grid. Hover the mouse pointer to read timeline values. Select a row in the grid to add that row to the graph.
- Some detailed graphs provide a dimension breakdown that lets you review the major contributors to the detected insights. For example, you can see which products or locations contributed most to the detected seasonality or signal correlation.
When you're done exploring the insights, select Back to time series to return to the time series.

