Note
Access to this page requires authorization. You can try signing in or changing directories.
Access to this page requires authorization. You can try changing directories.
[This article is prerelease documentation and is subject to change.]
The hierarchy visualization feature allows you to design and publish specific visualizations for your organization, that graphically displays the relationships found in your data. Unlike other tools that can only visualize data that conforms to some restrictive pre-defined model, feature allows you to easily create data visualizations from virtually any existing data model.
The Dynamics 365 Sales Hierarchy feature lets you design and publish visualizations that show relationships in your data. Unlike tools that only work with a restrictive predefined data model, the hierarchy feature lets you create visualizations from almost any data model.
- Admins design and publish hierarchies for the organization in minutes.
- Admins create complex hierarchies across multiple tables and relationship types in the hierarchy designer.
- Users get the same editing experience in a hierarchy as in forms, so the hierarchy view is an ideal primary workspace when data relationships matter.
- Users quickly navigate and change the hierarchy layout to suit their preferences for different data shapes.
Important
- This is a preview feature.
- Preview features aren’t meant for production use and might have restricted functionality. These features are subject to supplemental terms of use, and are available before an official release so that customers can get early access and provide feedback.
Types of hierarchy relationships
There are various relationships that can be visualized, and the hierarchy feature allows you to mix and match any of these approaches in a single visualization, providing flexibility.
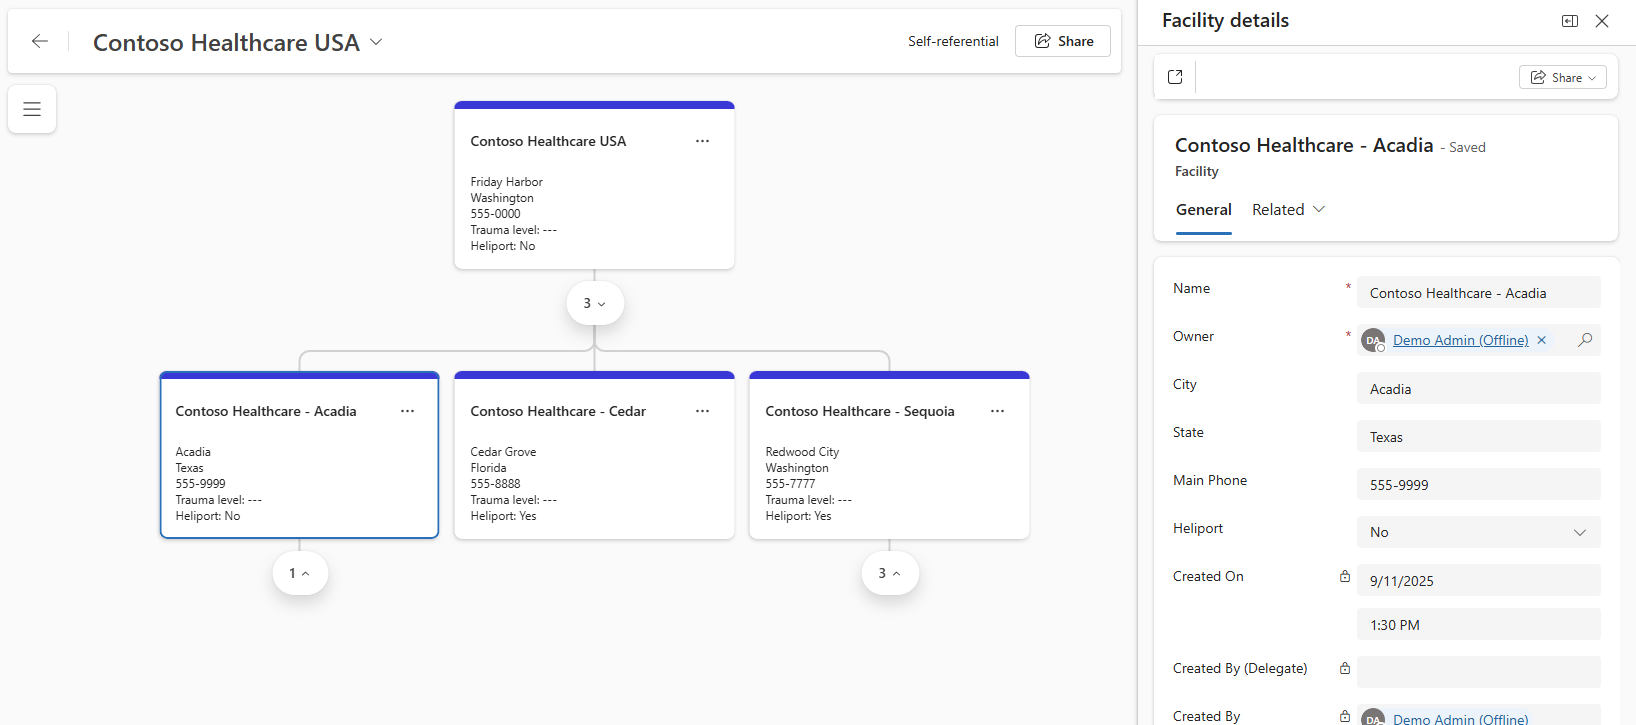
Self-referential
Use a single table to display a self-referential hierarchy—each row references its parent row in the same table. This hierarchy forms a tree of same-type records. For example, an account hierarchy shows a global company, its regional subsidiaries, and its branch offices. It also shows an entire organizational structure or a global distribution system hierarchy. To display this hierarchy, configure the table in the designer: select Expand all levels, then select the column that stores the parent reference.
An example of a self-referential hierarchy where all tiles are a record from a single table.
Cross-table relationships
Hierarchies can also visually show hierarchies of different types of data using the relationship data between two tables. For example, you may want to provide your sellers an Account view that shows opportunities directly related to the account, contacts, locations, or all of the above.
An example of a cross-table reference hierarchy with Account and Opportunity.

Hybrid hierarchies
Any table in a hierarchy can be configured to show self-referential data, allowing for interesting scenarios such as a self-referential hierarchy of accounts where each account tile shown might have its own contacts and opportunities. You might even have self-referential opportunities, so instead of just showing directly linked opportunities, you might see a tree of opportunities such as when a Deal opportunity must be closed before the Installation opportunity and Service Contract opportunities can be pursued.
Dataverse connections
The Dataverse connection table is an incredibly powerful feature that allows a record in any table to be assigned a relationship to another record in any table, allowing relationships to be defined at the record level instead of between entire tables. Connections also can be assigned a Connection Role that describes the kind of relationship between records, such as DecisionMaker, Influencer, or Daughter, allowing Views to filter the data based on one or more roles.
Custom connections
The sales hierarchy control lets you model hierarchies with a custom connections table. Specify which columns in your custom table identify the To and From fields and any custom roles. The control uses those relationships to build models that show your data the way you want.
Key capabilities of hierarchy visualization
The hierarchy visualization feature includes the following key capabilities:
- Drill down: Navigate through different levels of hierarchical data. You can expand and collapse branches, zoom in and out, and switch between vertical and horizontal layouts to get a clear view of the data structure.
- Customize tiles: Customize hierarchy tiles to meet your needs. This includes the ability to choose what fields to display on a tile, if descriptive labels are shown, if a picture should be shown, and the size and color of tiles.
- Fully editable details pane: Select a tile to display a details side pane that provides full capability to view and edit details for the record. Easily expand the side pane to full screen if desired.
- Quick actions: Use the quick actions on a tile to add new record or associate an existing record, or jump to the full screen details.
Getting started with hierarchy visualization
Using the hierarchy visualization feature involves two main roles: administrators who design and publish hierarchies, and users who view and interact with these hierarchies.
- To create and publish a hierarchy visualization, administrators can follow the steps outlined in Create and publish a hierarchy visualization.
- To manage existing hierarchy visualizations, administrators can refer to Manage hierarchy visualization.
- To add hierarchy visualization to custom and other tables, administrators can consult Add hierarchy visualization to custom tables.
- To view and understand hierarchy visualizations, users can follow the guidance in View and understand hierarchy visualization.