Note
Access to this page requires authorization. You can try signing in or changing directories.
Access to this page requires authorization. You can try changing directories.
| Enabled for | Public preview | General availability |
|---|---|---|
| Users, automatically | - |  Oct 1, 2025
 |
Business value
The improvements in reporting and analytics for sales help your business track new key performance indicators (KPIs) and scenarios in Power BI. Customizable Excel layouts for many sales reports let you tailor them to your needs, while enriched datasets provide more comprehensive analyses.
Feature details
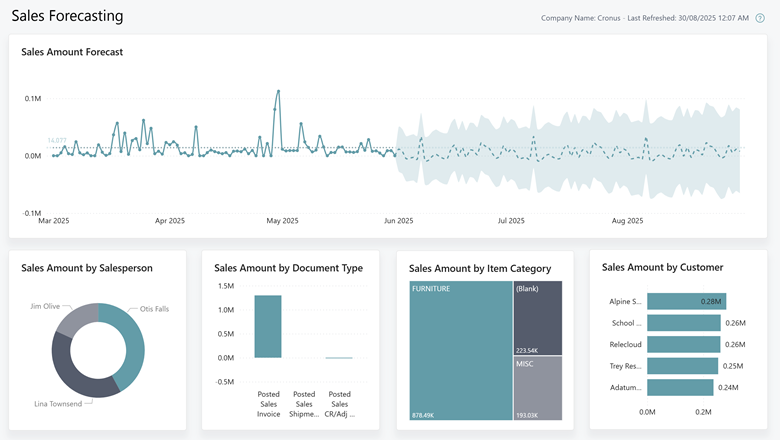
We've significantly improved reporting and analytics for sales. In Power BI, the Power BI Sales app now offers more capabilities.
The app offers new report pages:
- Sales forecasts
- Sales by Projects
We've made some changes to the semantic model:
- Use data from projects and the general ledger in your analyses.
- Source code is now open source.
We've also added modernized versions of the following sales reports:
- Customer List
- Customer - Order Summary
- Customer - Order Detail
- Sales Statistics
- Customer/Item Sales
- Customer Balance to Date
- Customer Trial Balance
- Sales Reservation Availability
- Inventory Order Details
- Inventory Sales Back Orders
By modernizing a report, we mean:
- We replaced RDL layouts with Word and Excel layouts.
- Documentation supplements in-client Help.


Geographic areas
Visit the Explore Feature Geography report for Microsoft Azure areas where this feature is planned or available.
Language availability
Visit the Explore Feature Language report for information on this feature's availability.