Note
Access to this page requires authorization. You can try signing in or changing directories.
Access to this page requires authorization. You can try changing directories.
| Enabled for | Public preview | General availability |
|---|---|---|
| Users, automatically | - |  Oct 1, 2025
 |
Business value
With the improvements in reporting and analytics for the purchasing area, your business can track new key performance indicators (KPIs) and scenarios in Power BI.
Feature details
We've updated the Power BI Purchasing app to give you better reporting and analytics capabilities for purchasing. The app now offers the following capabilities:
- A refactored semantic model that's ready for open source.
- Map visuals that display purchasing data by location.
- The model for the app lets you add dimensions as filters or slicers.
The updated Power BI app introduces the following new report pages:
- Key Purchasing Influencers
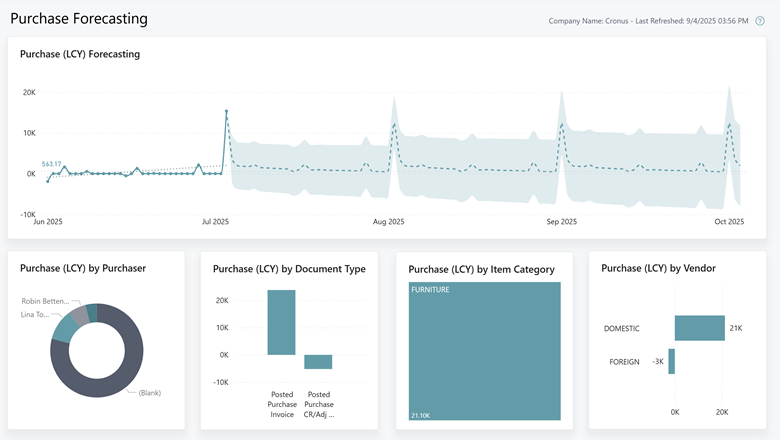
- Purchase Forecast Report
- Vendor Quality Analysis Report
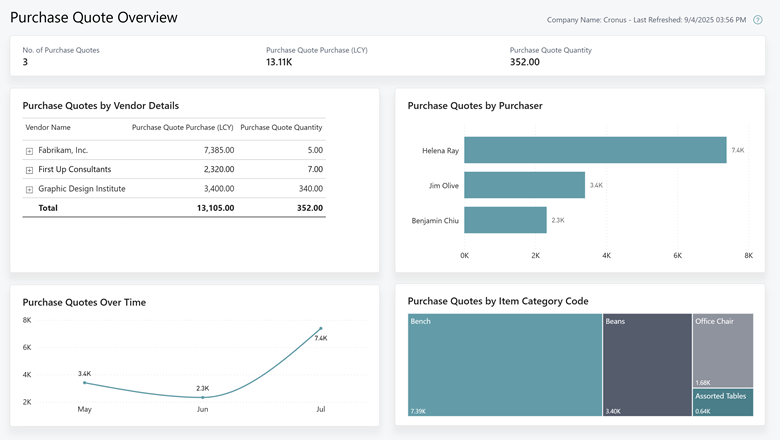
- Purchase Quote Overview
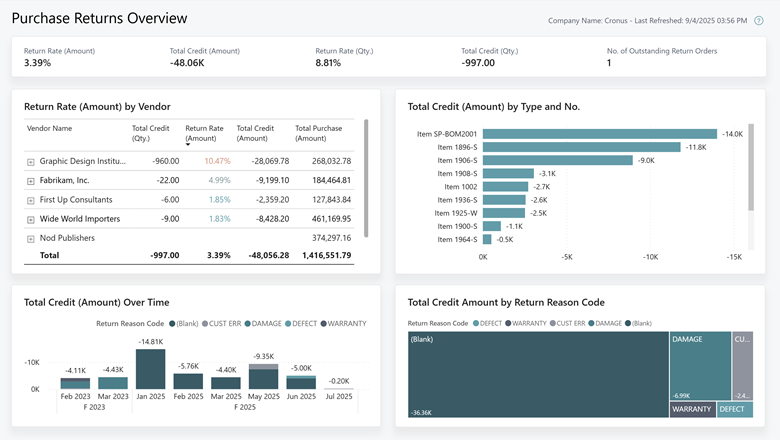
- Purchase Returns Overview
We also made some minor changes to existing report pages:
- Sales Returns Overview has new return rate measures for amount and quantity.
- Purchases by Item has a ribbon chart for Purchase Value by Fiscal Year and Item Category.
- Purchase Value by Item Category has a scatter plot.
- Purchases by Vendor includes Pareto reporting and a vendor purchases map.
- Purchase by Purchaser shows a Purchase Value by Purchaser scatter plot.
- Purchase by Location shows a Vendor Location map.


Geographic areas
Visit the Explore Feature Geography report for Microsoft Azure areas where this feature is planned or available.
Language availability
Visit the Explore Feature Language report for information on this feature's availability.