Note
Access to this page requires authorization. You can try signing in or changing directories.
Access to this page requires authorization. You can try changing directories.
| Enabled for | Public preview | General availability |
|---|---|---|
| Users, automatically | - |  Oct 1, 2025
 |
Business value
The updated Projects Power BI app gives project managers deeper, more accurate insights into project profitability and performance. With enhanced semantic models, including dynamic dimension support and new Project Statistics measures, reporting is now more precise and aligned with core Business Central data. Improved report pages and visualizations make it easier to compare budget to actual usage, track invoicing by type or customer, and monitor timelines with clearer visuals. Because the app is open source, businesses and partners can tailor models and reports to their unique needs, ensuring analytics that truly reflect their operations. This leads to faster, more informed decisions and stronger project outcomes.
Feature details
The updated Projects Power BI app for Business Central gives project managers a better overview of the profitability of their projects. Plus, partners and customers can build on the open-source model and reports to make their reporting on projects their own.
As part of getting the source code ready for open source, we also made changes to the semantic model and to the reports.
The following are key changes to the semantic model:
- Added dynamic dimension support (review the Dimension Sets table).
- Added Project Statistics measures in the Project Ledger and Project Planning Lines tables.
- Updated reconciliations so that the numbers match the values on the Project Statistics page.
- Added a new Type table to allow for type-specific reporting.
- Removed Starting and Ending Date tables.
- Task-related Starting and Ending Dates are now columns in the Tasks table.
The following are key changes to reports:
- Replaced existing measures with Project Statistic measures.
- Changed the Project Performance to Budget page so that it now compares Budget to Usage. Previously, it compared Budget to Invoiced.
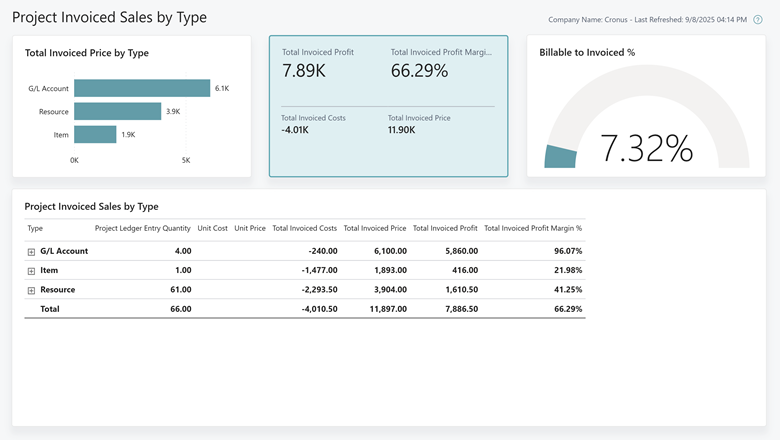
- Added new Type table fields to improve the Project Invoiced Sales by Type page.
- Added a Billable to Invoiced % gauge.
- Added new Type table fields to improve the Project Invoiced Sales by Customer page.
- Aligned report visuals with the Project Invoiced Sales by Type report.
- Changed the Gantt chart style on the Project Timeline page to use square bars, so that it aligns with changes to reports in manufacturing.

Geographic areas
Visit the Explore Feature Geography report for Microsoft Azure areas where this feature is planned or available.
Language availability
Visit the Explore Feature Language report for information on this feature's availability.
Tell us what you think
Help us improve Dynamics 365 Business Central by discussing ideas, providing suggestions, and giving feedback. Use the forum at https://aka.ms/bcideas.