Note
Access to this page requires authorization. You can try signing in or changing directories.
Access to this page requires authorization. You can try changing directories.
In this article, you learn how to integrate Oracle Exadata Database Service@ Azure logs with Azure Monitor and Microsoft Sentinel by sending them to a Log Analytics workspace. Azure Monitor Logs is a centralized software as a service (SaaS) platform for collecting, analyzing, and acting on telemetry data generated by Azure and non-Azure resources like Oracle Exadata Database Service@Azure. You can collect logs, manage log data and costs, and consume different types of data in one Log Analytics workspace,the primary Azure Monitor Logs resource.
This integration enhances observability by enabling centralized monitoring, correlation, and analysis of operational and database logs.Additionally, diagnostic settings allow you to archive logs to a storage account, stream them to an event hub, or send them to a partner solution—providing flexible options for retaining, analyzing, and acting on critical system insights.
Following types of logs are supported.
Exadata VM cluster Life Cycle Management Logs
Exadata Database logs
Exadata Infrastructure Logs
Exadata Data Guard logs
Integrating Oracle Exadata Database and Exadata Infrastructure logs with the Azure portal provides a broad range of benefits, including:
1. Centralized Monitoring and Management
Unified view of logs from various Azure services (for example, VMs, App Services, AKS, and Oracle Databases@Azure).
Simplifies troubleshooting by correlating logs across services in one place.
Selectively deliver different types of logs to different destinations for more controlled viewing.
2. Real-Time Insights and Alerts
Use Azure Monitor and Log Analytics to query logs in real time.
Set up alerts based on log queries to proactively detect issues (for example, failed deployments, performance bottlenecks).
3. Advanced Querying with Kusto Query Language (KQL)
Powerful querying capabilities to analyze logs deeply.
Enables custom dashboards and reports tailored to specific operational needs.
4. Integration with Azure Services
Seamless integration with services like:
Azure Security Center for threat detection.
Azure Sentinel for Security Information Event Management (SIEM) and security orchestration, automation, and response (SOAR)
5. Automation and Remediation
Trigger Azure Logic Apps or Functions based on log events.
Automate responses to incidents (for example, restart a service when a failure is logged).
6. Compliance and Auditing
Retain logs for auditing and compliance purposes.
Use Azure Policy and Activity Logs to track changes and access.
7. Scalability and Cost Management
Logs stored in Log Analytics workspace scale with your needs.
Control costs with data retention policies and sampling.
8. Custom Dashboards and Visualization
Create rich visualizations using Azure Workbooks.
Share dashboards with stakeholders for transparency and collaboration.
Prerequisites
- Oracle Database@Azure provisioned: Deploy an Exadata virtual machine (VM) cluster in a delegated subnet in an Azure virtual network. First, we need to create an Exadata Infrastructure.
Log Analytics workspace: A Log Analytics workspace is a data store into which you can collect any type of log data from all of your Azure and non-Azure resources like Exadata VM clusters and Exadata Infrastructure. Workspace configuration options let you manage all of your log data in one workspace to meet the operations, analysis, and auditing needs of different personas in your organization.
Microsoft Sentinel: Microsoft Sentinel is a cloud-native SIEM (security information and event management) and SOAR (security orchestration automated response) solution that helps organizations collect, analyze, and respond to security threats across their hybrid cloud environments. Microsoft Sentinel applies the power of artificial intelligence (AI) and machine learning (ML) to automate Security threat detection and response, reduce false positives, and improve security operations efficiency.
Azure subscription and permissions: Ensure that you have sufficient Azure permissions:
- Azure Owner or Contributor role on the subscription or resource group to enable Microsoft Sentinel and create Log Analytics workspace.
Step 1: Create and configure a diagnostic setting
Navigate to the Azure portal and select either Oracle Exadata VM cluster or Oracle Exadata Infrastructure you want to monitor.
Go to the Diagnostic settings section and select Add diagnostic setting.
Choose the logs you want to send to Azure destinations using the below check box options:

- Choose the destinations:
Below are the destinations you can send the logs to

A few things to know
Logs may be delayed. After enabling diagnostic settings, it can take up to an hour for logs and events to start showing up in Azure Monitor or your selected destination.
Diagnostic settings are limited to five per resource. You can create up to five diagnostic settings per Exadata resource.
No duplicate destinations. You can’t create two diagnostic settings that send the same log categories to the same destination — each configuration must be unique.
Step 2: Set up Log Analytics workspace
Set up a LA workspace by creating a new LA workspace resource in Azure portal.
Select the created LA workspace as destination while setting up the diagnostic settings on the Exadata VM cluster or Exadata Infrastructure Resource.
Ensure the Exadata VM cluster resource and LA workspace are under the same subscription.
Navigate to above created LA workspace once any events are generated and logs are to be verified.
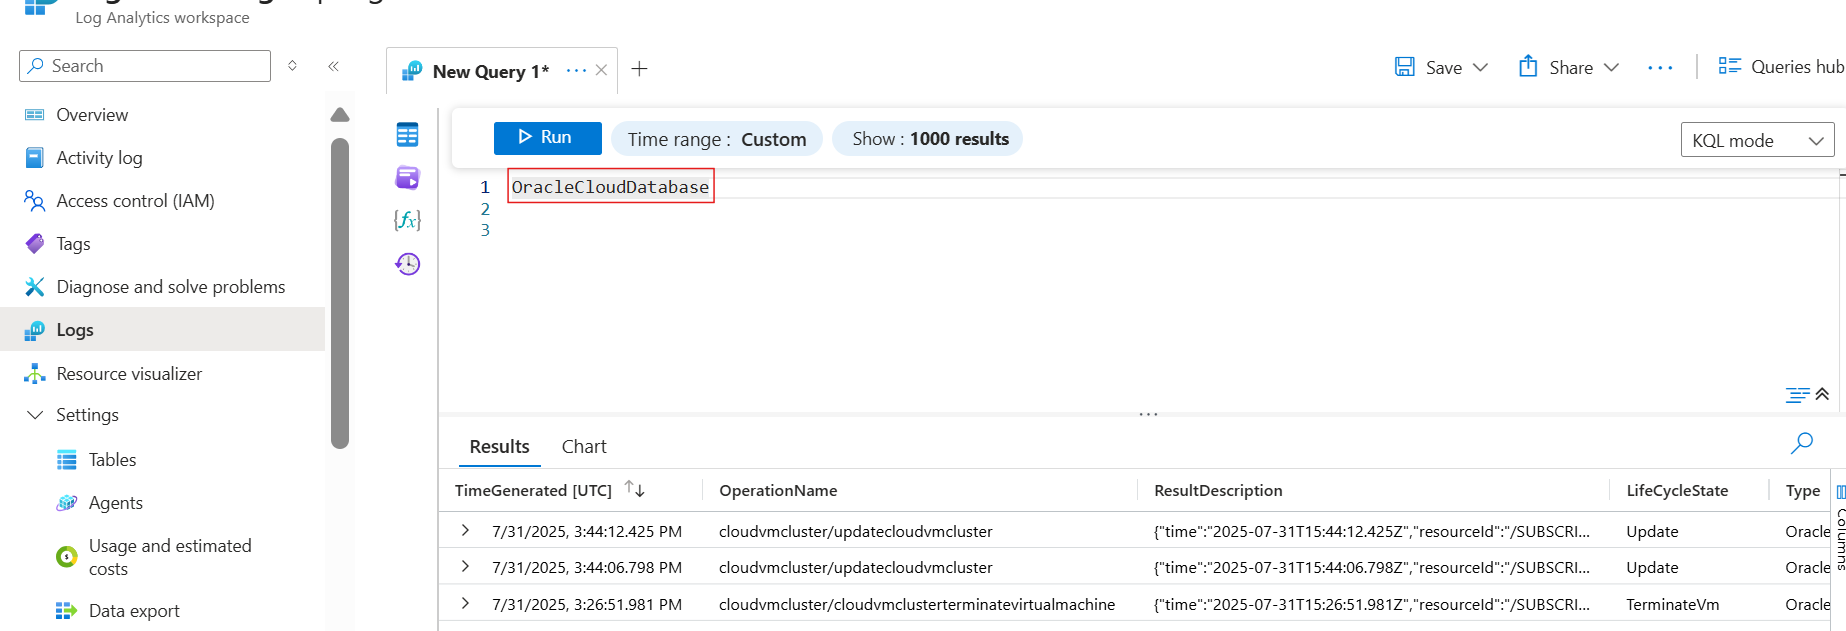
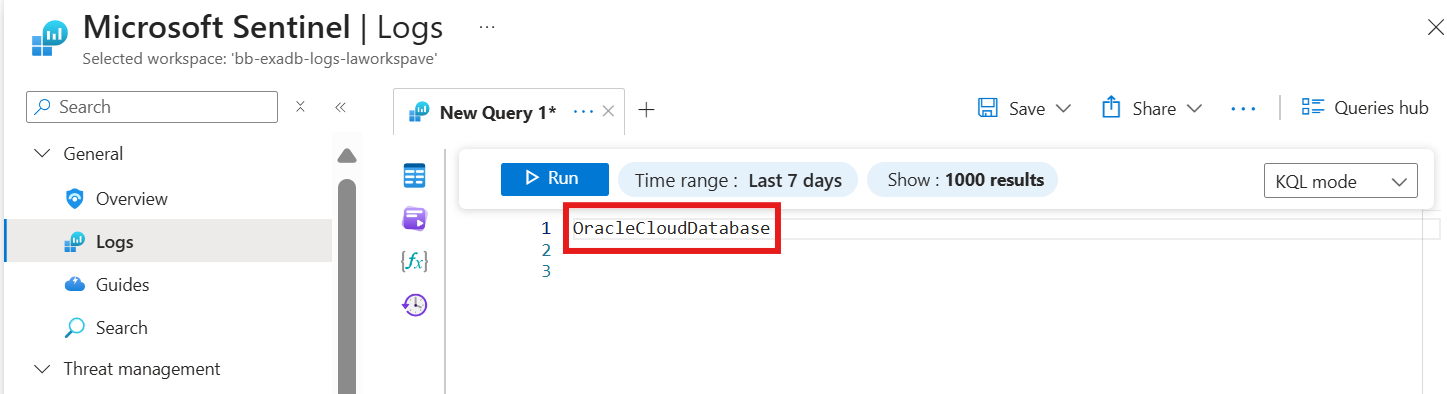
Navigate to Logs section under the LA workspace side bar menu. Provide them with the option to view "logs" directly from the Exadata Resource page itself, with changing scope.
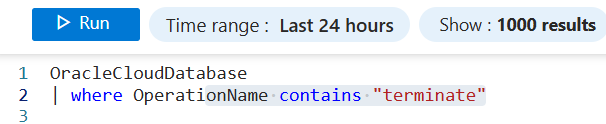
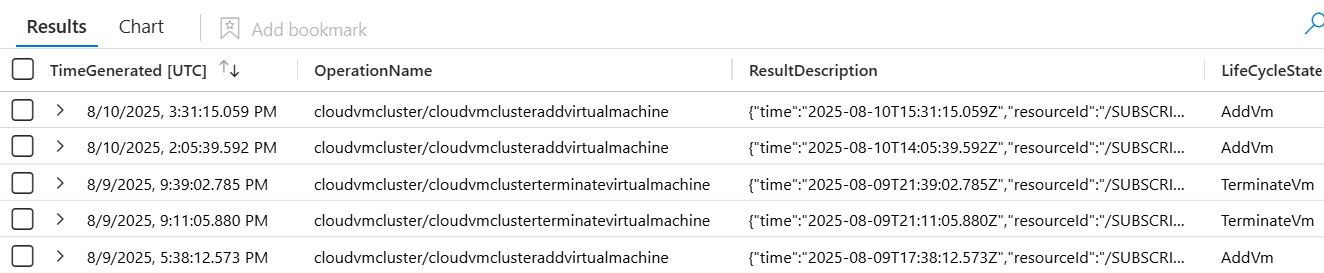
Switch to KQL mode from simple mode using the drop-down on the right end. A query run window pops up with options to write your own query in KQL along with using filters for adjusting the time range. Type in OracleCloudDatabase in the command prompt window and select on Run to fetch the results of logs ingested for various events in the OracleCloudDatabase table.
The result set should show the list of events occurred and corresponding meta data generated using the above setup.

Step 3: Archive logs in Storage account
Set up a storage account by creating a new Storage account resource in Azure portal.
Ensure the Exadata Resource and Storage account resource are under the same subscription.
Select the above created Storage account as destination while setting up the diagnostic settings on the Exadata Resource.
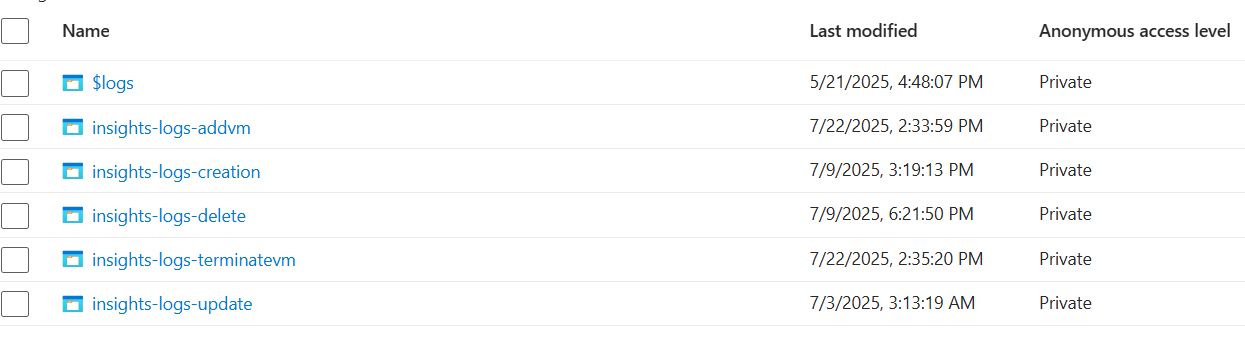
Navigate to above created Storage account once any events are generated and logs are to be verified. You can find it by searching for the Storage account name or by navigating through the resource group where it's located.
In the Storage account, navigate to the Containers section. Here you find containers that store the logs. The container names typically reflect the nature of the operation, such as creation events, deletion events, or update events.
Open the relevant container to browse the logs. The logs are usually organized by date, making it easier to find the specific logs you're looking for.

Step 4: Stream logs to Event Hubs
Create Event hub namespace and an Event Hubs instance in Azure portal following the instructions here Event Hubs - Capture streaming events using Azure portal - Azure Event Hubs | Microsoft Learn
Ensure that you have configured diagnostic settings for the Exadata Resource you want to monitor. This involves selecting the logs you want to send and specifying the Event Hub as the destination.
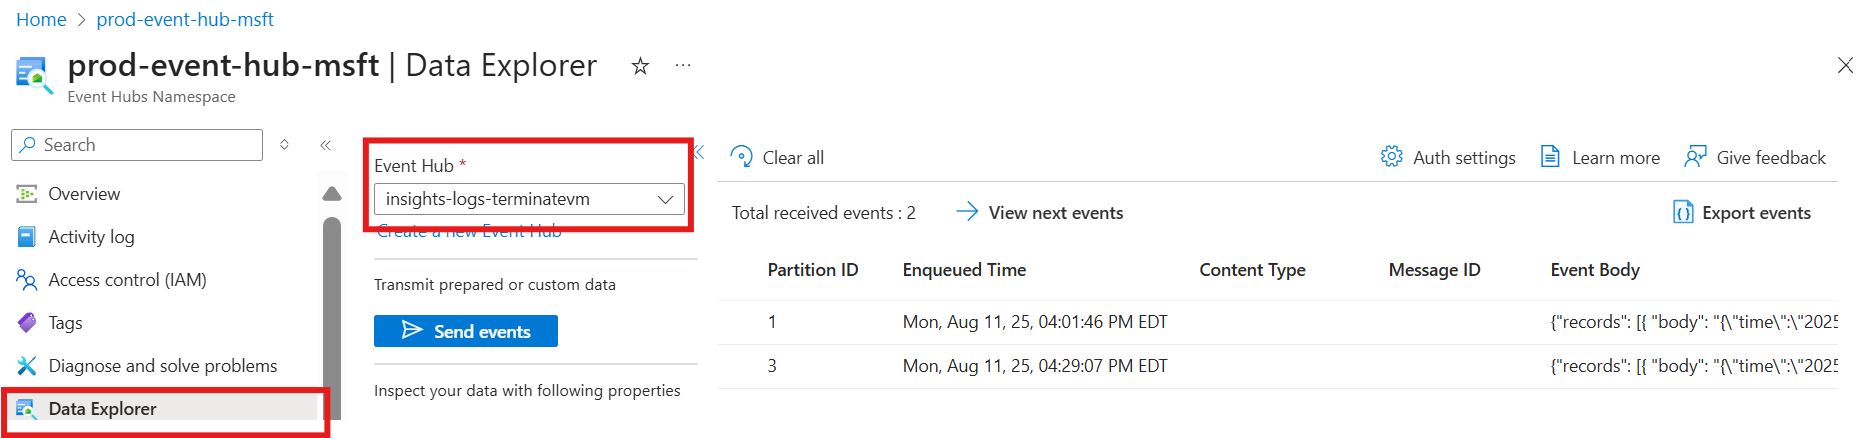
Use the Azure portal to monitor the Event Hub by navigating to Data Explorer section of Event Hub namespace. Navigate to the Event Hub namespace and select the specific Event Hub instance as shown below.
Ensure to select the right Event hub instance and consumer group and select on View events to retrieve the list of occurrences and their corresponding meta data.
The event hub is the category. When event hub isn't provided, then the logs are routed to the natural category like creation etc. but The customer can select the eventhub while creating the diagnostic setting to ensure all the logs are routed to the same eventhub.

Step 5: Send to Partner Solution
Create Event hub namespace and an Event Hub instance in Azure portal following the instructions here Event Hubs - Capture streaming events using Azure portal - Azure Event Hubs | Microsoft Learn
Enable SSO sign in through Azure portal by enabling Single sign On through Microsoft Entra ID Configure predeployment to use Azure Native Dynatrace Service - Azure Native ISV Services | Microsoft Learn.
Ensure that you have configured diagnostic settings for the ExaData VM Cluster you want to monitor. This involves selecting the logs you want to send and specifying the Event Hub as the destination.
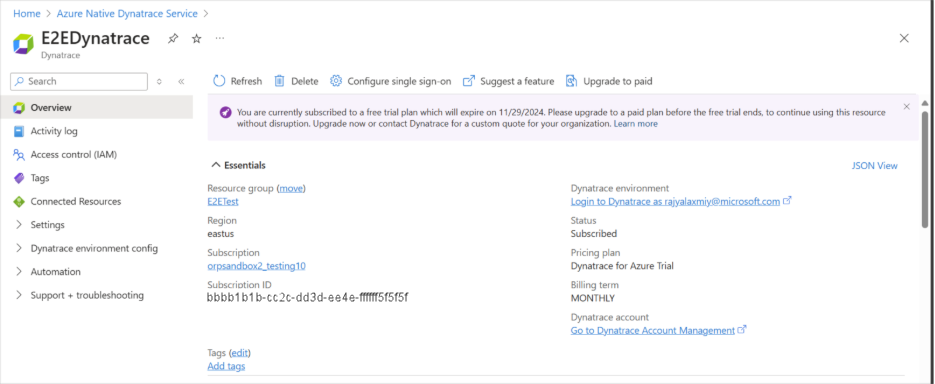
Navigate to above created Dynatrace resource once any events are generated and logs are to be verified. You can find it by searching for the Azure Native Dynatrace service or by navigating through the resource group where it's located.
Once you are in the Dynatrace instance, navigate to Dynatrace environment using the SSO link.
Navigate to Logs explorer section in Dynatrace environment using the side menu.

The established integration pipeline should show the ingested logs for various events occurred.
To filter for specific log events, use the following query to evaluate the logs:
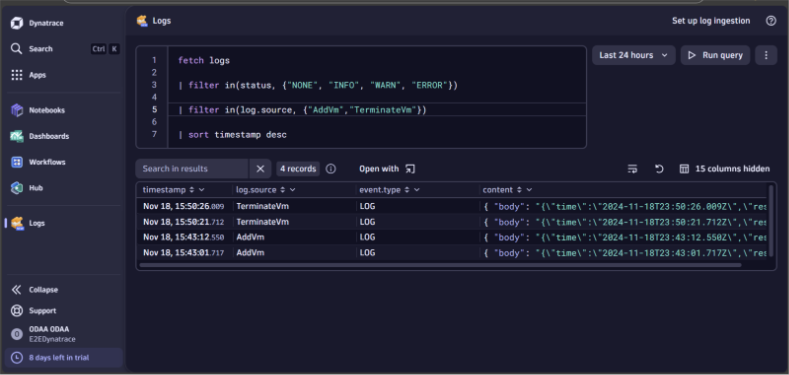
More columns from the result set can be added by applying the Hidden columns on


Step 6: Setup Alerts and Monitoring
Go to Azure Portal > Monitor > Alerts > + Create > Alert rule. Overview of Azure Monitor alerts - Azure Monitor | Microsoft Learn
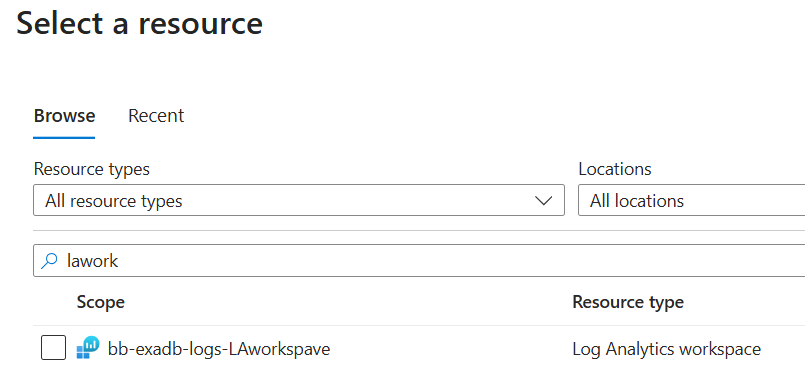
Select the target resource in search tab by typing LA workspace name
Select the condition as custom log search and create a query as follows:
Set the Action group
Create or select an Action Group:
Email
SMS
Webhook
Azure Function
Name the alert rule with severity
Review and create


Step 7: Set up Microsoft Sentinel
To get started, add Microsoft Sentinel to an existing workspace or create a new one.
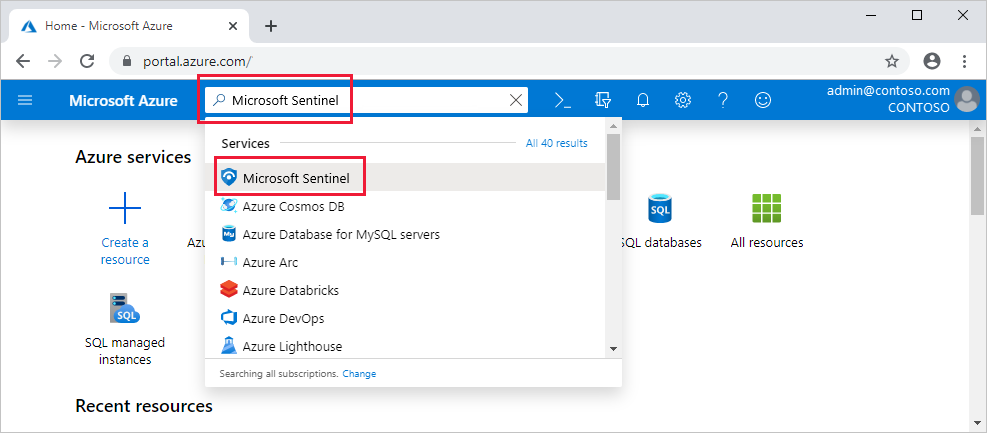
Sign in to the Azure portal.
Search for and select Microsoft Sentinel.
Select Create.
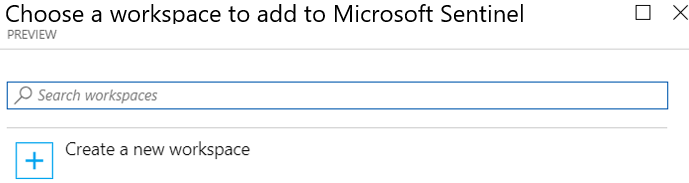
Select the workspace you want to use or create a new one. You can run Microsoft Sentinel on more than one workspace, but data is isolated to a single workspace.
The default workspaces created by Microsoft Defender for Cloud aren't shown in the list. You can't install Microsoft Sentinel on these workspaces.
Once deployed on a workspace, Microsoft Sentinel doesn't support moving that workspace to another resource group or subscription.
Select Add.
Check the logs in Microsoft Sentinel by switching to KQL mode. Once the OracleCloudDatabase table is created, Microsoft Sentinel treats it like any other table, allowing you to run analytics queries and configure incident rules based on your specific requirements.
Categories of detection rules supported:
Microsoft Sentinel provides pre-defined detection rules that are Microsoft proprietary.
Anomaly detection logic of such predefined rules is not exposed to customers.
Customers can also define their own detection rules called Custom rules.
Scheduled analytical Rules & Near real time (NRT) rules are such customizable rules currently supported by Microsoft Sentinel.
In the background, these rules are Kusto queries defined as per the customer requirements and frequency of runs needed.


