Note
Access to this page requires authorization. You can try signing in or changing directories.
Access to this page requires authorization. You can try changing directories.
Important
WebAssembly (WASM) with data flow graphs is in preview. This feature has limitations and isn't for production workloads.
See the Supplemental Terms of Use for Microsoft Azure Previews for legal terms that apply to Azure features that are in beta, preview, or not yet released into general availability.
Azure IoT Operations data flow graphs support WebAssembly (WASM) modules for custom data processing at the edge. You can deploy custom business logic and data transformations as part of your data flow pipelines.
Tip
Want to run AI in-band? See Run ONNX inference in WebAssembly data flow graphs to package and execute small ONNX models inside your WASM operators.
Important
Data flow graphs currently only support MQTT, Kafka, and OpenTelemetry endpoints. Other endpoint types like Data Lake, Microsoft Fabric OneLake, Azure Data Explorer, and Local Storage are not supported. For more information, see Known issues.
Prerequisites
- Deploy an Azure IoT Operations instance, version 1.2 preview or later, on an Arc-enabled Kubernetes cluster. For more information, see Deploy Azure IoT Operations.
- Use Azure Container Registry (ACR) to store WASM modules and graphs.
- Install the OCI Registry As Storage (ORAS) CLI to push WASM modules to the registry.
- Develop custom WASM modules by following guidance in Develop WebAssembly modules for data flow graphs.
Overview
WebAssembly (WASM) modules in Azure IoT Operations data flow graphs let you process data at the edge with high performance and security. WASM runs in a sandboxed environment and supports Rust and Python.
How WASM data flow graphs work
The WASM data flow implementation follows this workflow:
- Develop WASM modules: Write custom processing logic in a supported language and compile it to the WebAssembly Component Model format.
- Develop graph definition: Define how data moves through the modules by using YAML configuration files. For detailed information, see Configure WebAssembly graph definitions.
- Store artifacts in registry: Push the compiled WASM modules to a container registry by using OCI-compatible tools such as ORAS.
- Configure registry endpoints: Set up authentication and connection details so Azure IoT Operations can access the container registry.
- Create data flow: Define data sources, the artifact name, and destinations.
- Deploy and execute: Azure IoT Operations pulls WASM modules from the registry and runs them based on the graph definition.
Get started with examples
These examples show how to set up and deploy WASM data flow graphs for common scenarios. The examples use hardcoded values and simplified configurations so you can get started quickly.
Set up container registry
Azure IoT Operations needs a container registry to pull WASM modules and graph definitions. You can use Azure Container Registry (ACR) or another OCI-compatible registry.
To create and configure an Azure Container Registry, see Deploy Azure Container Registry.
Install ORAS CLI
Use the ORAS CLI to push WASM modules and graph definitions to your container registry. For installation instructions, see Install ORAS.
Pull sample modules from public registry
For this preview, use prebuilt sample modules:
# Pull sample modules and graphs
oras pull ghcr.io/azure-samples/explore-iot-operations/graph-simple:1.0.0
oras pull ghcr.io/azure-samples/explore-iot-operations/graph-complex:1.0.0
oras pull ghcr.io/azure-samples/explore-iot-operations/temperature:1.0.0
oras pull ghcr.io/azure-samples/explore-iot-operations/window:1.0.0
oras pull ghcr.io/azure-samples/explore-iot-operations/snapshot:1.0.0
oras pull ghcr.io/azure-samples/explore-iot-operations/format:1.0.0
oras pull ghcr.io/azure-samples/explore-iot-operations/humidity:1.0.0
oras pull ghcr.io/azure-samples/explore-iot-operations/collection:1.0.0
oras pull ghcr.io/azure-samples/explore-iot-operations/enrichment:1.0.0
oras pull ghcr.io/azure-samples/explore-iot-operations/filter:1.0.0
Push modules to your registry
Once you have the sample modules and graphs, push them to your container registry. Replace <YOUR_ACR_NAME> with the name of your Azure Container Registry.
# Log in to your ACR
az acr login --name <YOUR_ACR_NAME>

# Push modules to your registry
oras push <YOUR_ACR_NAME>.azurecr.io/graph-simple:1.0.0 graph-simple.yaml
oras push <YOUR_ACR_NAME>.azurecr.io/graph-complex:1.0.0 graph-complex.yaml
oras push <YOUR_ACR_NAME>.azurecr.io/temperature:1.0.0 temperature-1.0.0.wasm
oras push <YOUR_ACR_NAME>.azurecr.io/window:1.0.0 window-1.0.0.wasm
oras push <YOUR_ACR_NAME>.azurecr.io/snapshot:1.0.0 snapshot-1.0.0.wasm
oras push <YOUR_ACR_NAME>.azurecr.io/format:1.0.0 format-1.0.0.wasm
oras push <YOUR_ACR_NAME>.azurecr.io/humidity:1.0.0 humidity-1.0.0.wasm
oras push <YOUR_ACR_NAME>.azurecr.io/collection:1.0.0 collection-1.0.0.wasm
oras push <YOUR_ACR_NAME>.azurecr.io/enrichment:1.0.0 enrichment-1.0.0.wasm
oras push <YOUR_ACR_NAME>.azurecr.io/filter:1.0.0 filter-1.0.0.wasm
Tip
You can also push your own modules and create custom graphs, see Configuration of custom data flow graphs.
Create a registry endpoint
A registry endpoint defines the connection to your container registry. Data flow graphs use registry endpoints to pull WASM modules and graph definitions from container registries. For detailed information about configuring registry endpoints with different authentication methods and registry types, see Configure registry endpoints.
For quick setup with Azure Container Registry, create a registry endpoint with system-assigned managed identity authentication:
Currently, you can't create registry endpoints in the operations experience. You must use Bicep or Kubernetes manifests. After you create a registry endpoint, the graphs you pushed to your container registry are ready to be used in operations experience in data flow graphs.
Note
You can reuse registry endpoints across multiple data flow graphs and other Azure IoT Operations components, like Akri connectors.
Get extension name
# Get extension name
az k8s-extension list \
  --resource-group <RESOURCE_GROUP> \
  --cluster-name <CLUSTER_NAME> \
  --cluster-type connectedClusters \
  --query "[?extensionType=='microsoft.iotoperations'].name" \
  --output tsv
The first command returns the extension name (for example, azure-iot-operations-4gh3y).
Configure managed identity permissions
To let Azure IoT Operations pull WASM modules from your container registry, give the managed identity the right permissions. The IoT Operations extension uses a system-assigned managed identity that needs the AcrPull role on your Azure Container Registry. Make sure you have the following prerequisites:
- Owner permissions on the Azure Container Registry.
- The container registry can be in a different resource group or subscription, but it must be in the same tenant as your IoT Operations deployment.
Run these commands to assign the AcrPull role to the IoT Operations managed identity:
# Get the IoT Operations extension managed identity
export EXTENSION_OBJ_ID=$(az k8s-extension list --cluster-name $CLUSTER_NAME -g $RESOURCE_GROUP --cluster-type connectedClusters --query "[?extensionType=='microsoft.iotoperations'].identity.principalId" -o tsv)

# Get the application ID for the managed identity
export SYSTEM_ASSIGNED_MAN_ID=$(az ad sp show --id $EXTENSION_OBJ_ID --query "appId" -o tsv)

# Assign the AcrPull role to the managed identity
az role assignment create --role "AcrPull" --assignee $SYSTEM_ASSIGNED_MAN_ID --scope "/subscriptions/$SUBSCRIPTION_ID/resourceGroups/$RESOURCE_GROUP/providers/Microsoft.ContainerRegistry/registries/$ACR_NAME"
For more information about container registry roles, see Azure Container Registry roles and permissions.
If you get authentication errors with the Azure CLI, assign permissions in the Azure portal:
- Go to your Azure Container Registry in the Azure portal.
- Select Access control (IAM) from the menu.
- Select Add > Add role assignment.
- Choose the AcrPull built-in role.
- Select User, group, or service principal as the assign access to option.
- Search for and select your IoT Operations extension name (for example,
azure-iot-operations-4gh3y). - Select Save to finish the role assignment.
For detailed instructions, see Assign Azure roles using the Azure portal.
Example 1: Basic deployment with one WASM module
This example converts temperature data from Fahrenheit to Celsius by using a WASM module. The temperature module source code is available on GitHub. Use the precompiled version graph-simple:1.0.0 that you pushed to your container registry.
How it works
The graph definition creates a simple, three-stage pipeline:
- Source: Receives temperature data from MQTT
- Map: Processes data with the temperature WASM module
- Sink: Sends converted data back to MQTT
For detailed information about how the simple graph definition works and its structure, see Example 1: Simple graph definition.
Input format:
{"temperature": {"value": 100.0, "unit": "F"}}
Output format:
{"temperature": {"value": 37.8, "unit": "C"}}
The following configuration creates a data flow graph that uses this temperature conversion pipeline. The graph references the graph-simple:1.0.0 artifact, which contains the YAML definition and pulls the temperature module from your container registry.
Configure the data flow graph
This configuration defines three nodes that implement the temperature conversion workflow: a source node that subscribes to incoming temperature data, a graph processing node that runs the WASM module, and a destination node that publishes the converted results.
The data flow graph resource "wraps" the graph definition artifact and connects its abstract source/sink operations to concrete endpoints:
- The graph definition's
sourceoperation connects to the data flow's source node (MQTT topic) - The graph definition's
sinkoperation connects to the data flow's destination node (MQTT topic) - The graph definition's processing operations run within the graph processing node
This separation lets you deploy the same graph definition with different endpoints across environments while keeping the processing logic unchanged.
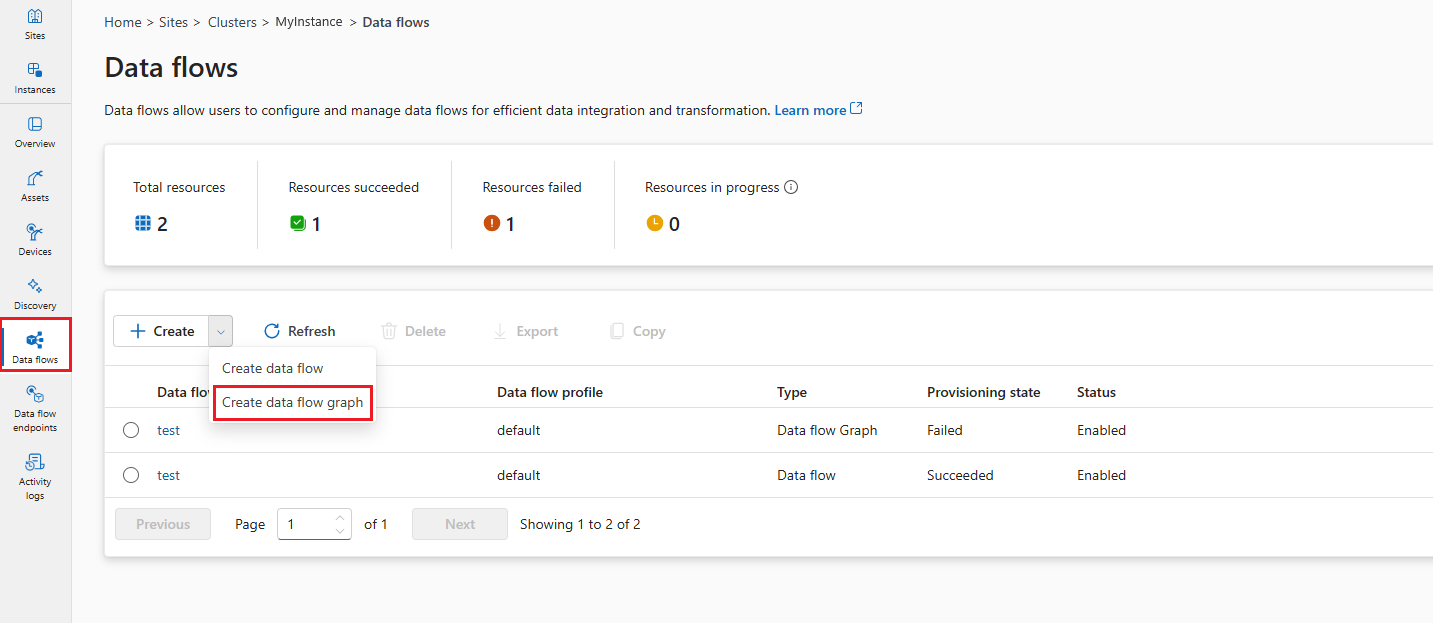
To create a data flow graph in operations experience, go to Data flow tab.
Select the drop-down menu next to + Create and select Create a data flow graph
Select the placeholder name new-data-flow to set the data flow properties. Enter the name of the data flow graph and choose the data flow profile to use.
In the data flow diagram, select Source to configure the source node. Under Source details, select Asset or Data flow Endpoint.
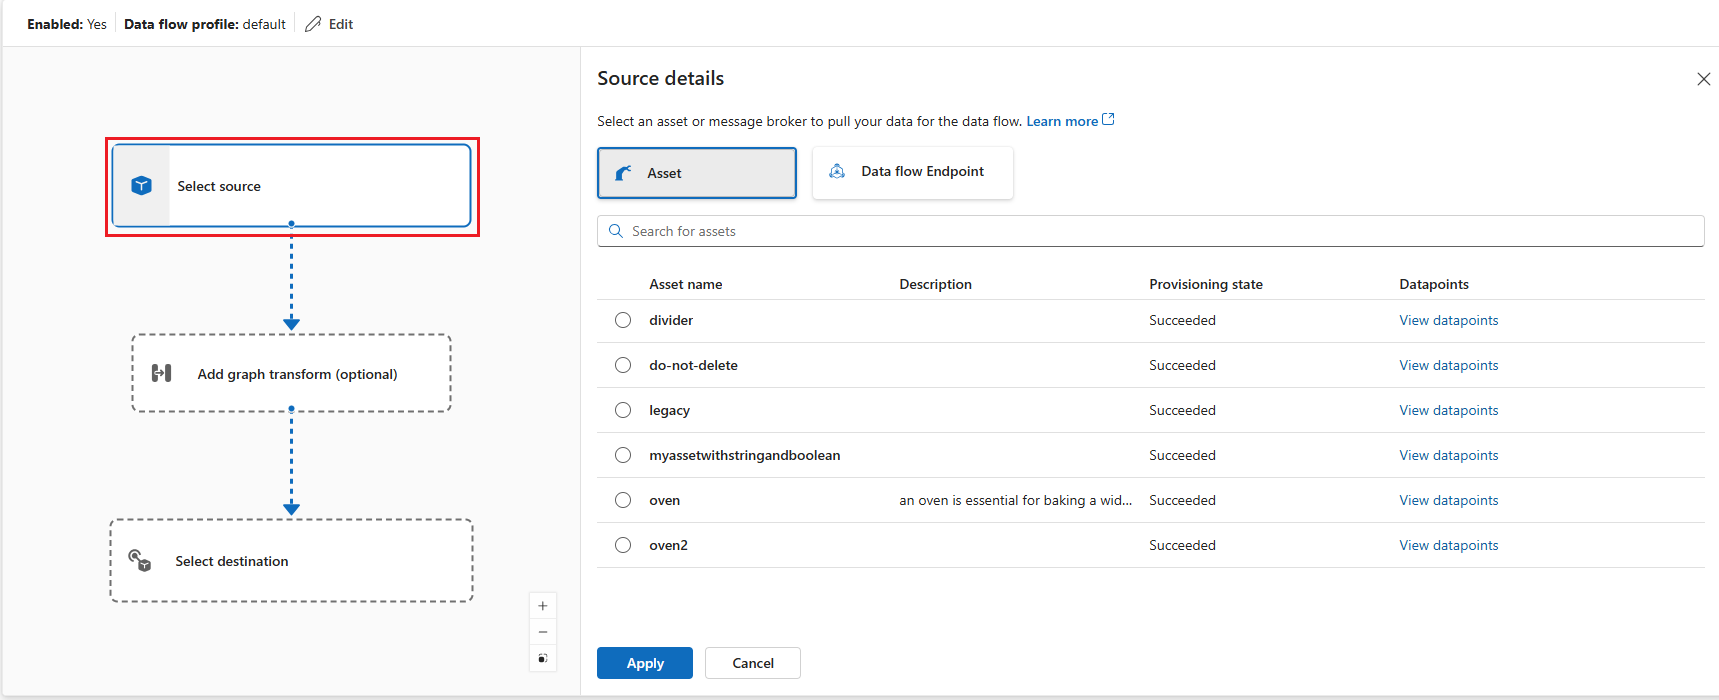
If you select Asset, choose the asset to pull data from and click Apply.
If you select Data flow Endpoint, enter the following details and click Apply.
Setting Description Data flow endpoint Select default to use the default MQTT message broker endpoint. Topic The topic filter to subscribe to for incoming messages. Use Topic(s) > Add row to add multiple topics. Message schema The schema to use to deserialize the incoming messages.
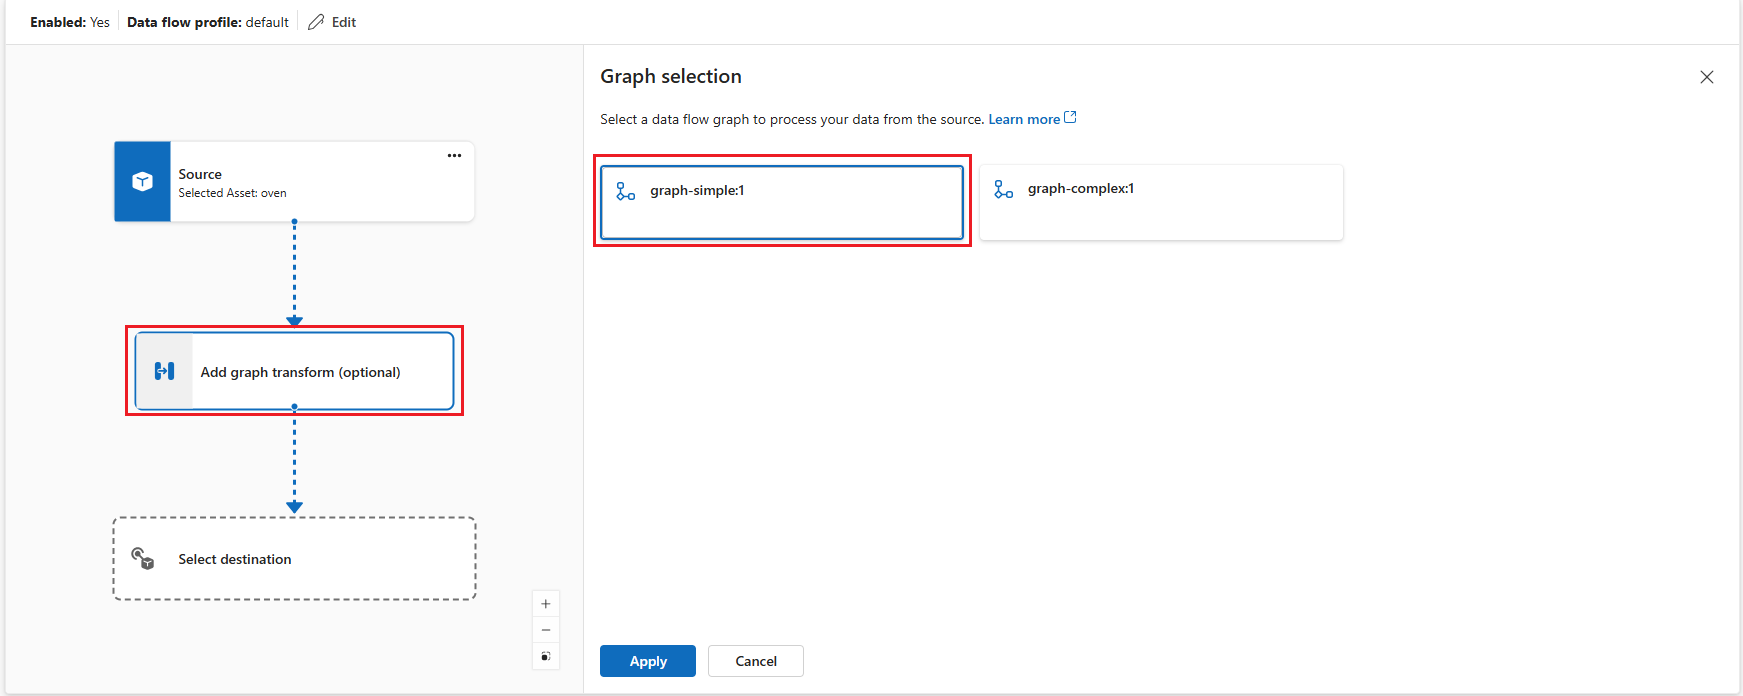
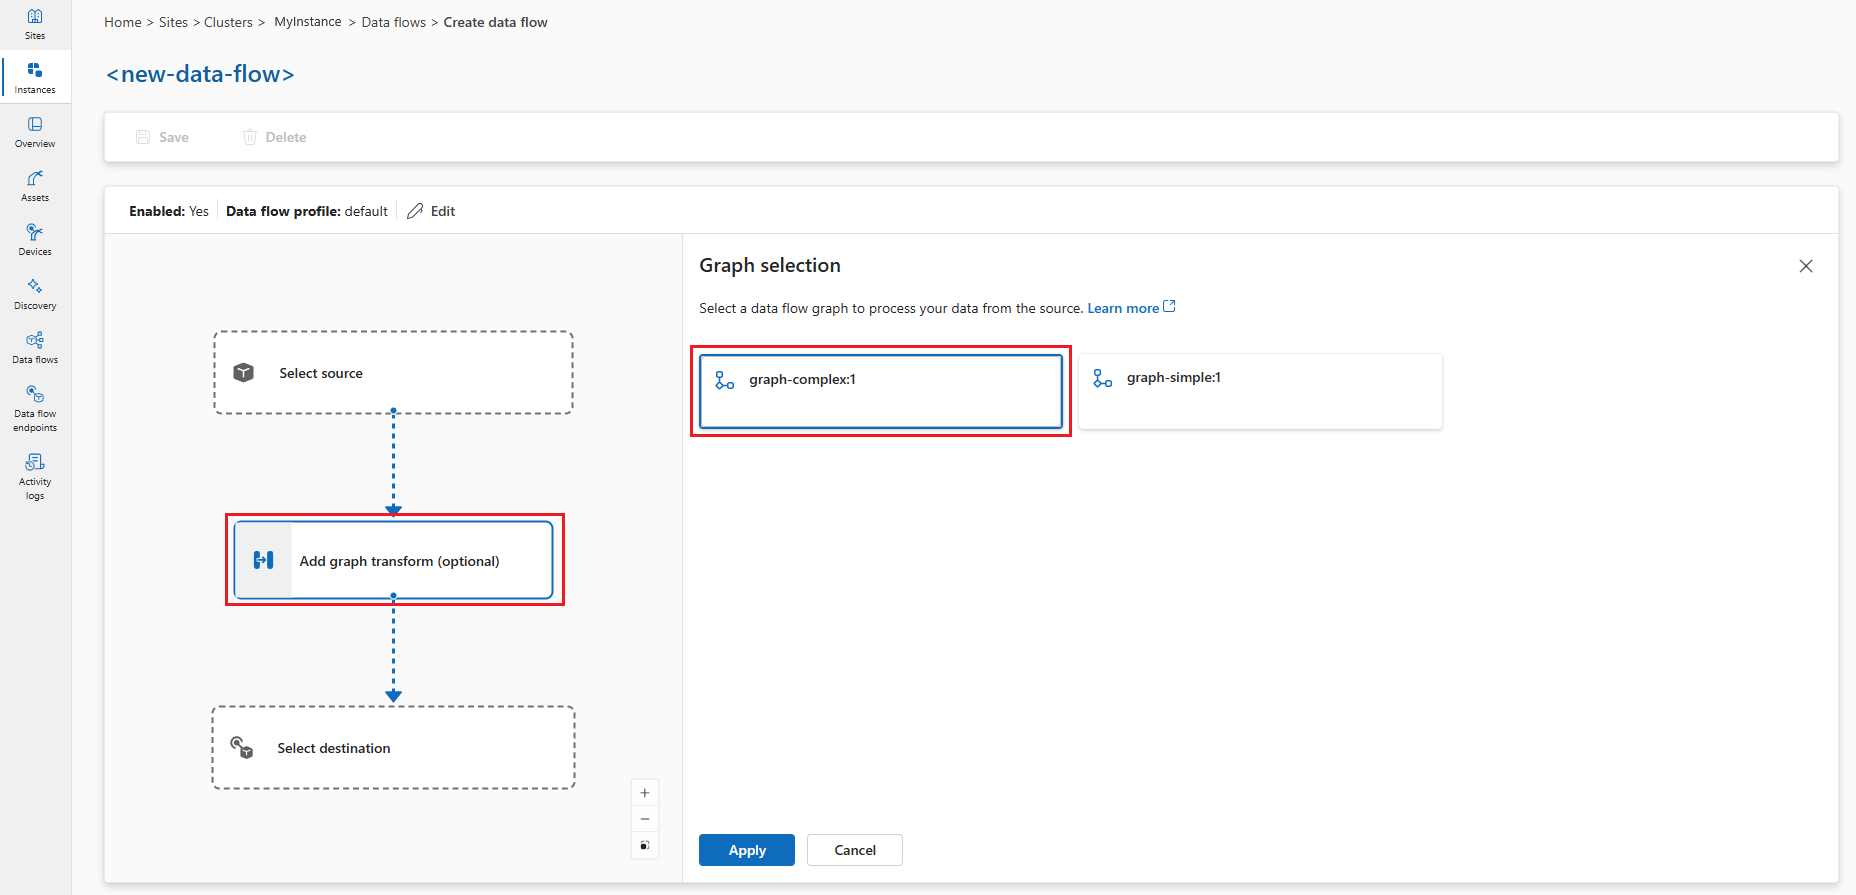
In the data flow diagram, select Add graph transform (optional) to add a graph processing node. In the Graph selection pane, select graph-simple:1 and click Apply.
Important
This example uses the
graph-simple:1.0.0artifact that you pushed to your container registry. You can create your custom graphs by developing your own WASM modules and pushing them to your container registry. The graphs you push to your container registry are available in the Graph selection pane.You can configure some graph operator settings by selecting the graph node in the diagram. For example, you can select module-temperature/map operator and enter in
key2the valueexample-value-2. Click Apply to save the changes.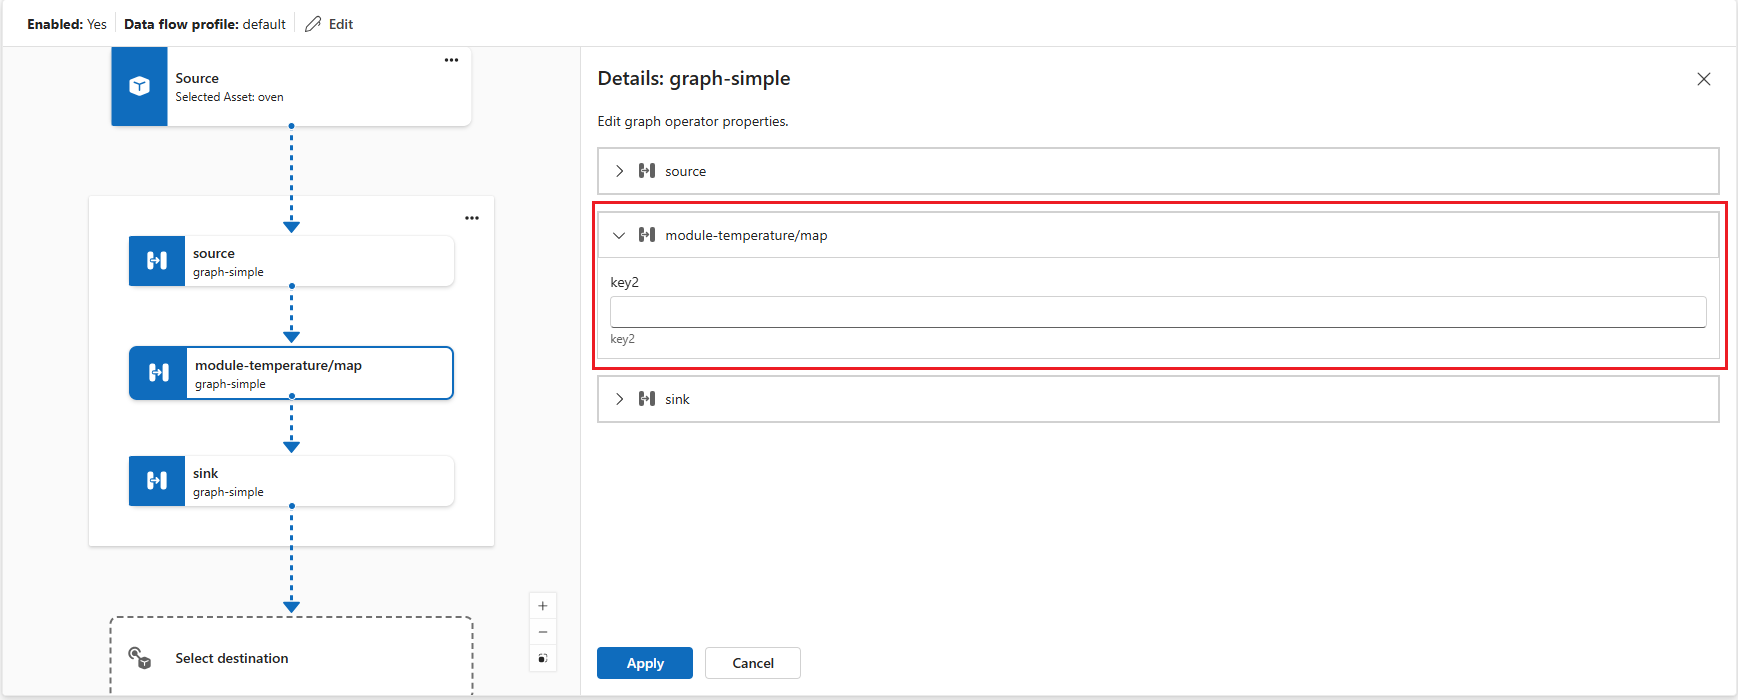
In the data flow diagram, select Destination to configure the destination node.
Select Save under the data flow graph name to save the data flow graph.
Test the data flow
To test the data flow, send MQTT messages from within the cluster. First, deploy the MQTT client pod by following the instructions in Test connectivity to MQTT broker with MQTT clients. The MQTT client provides the authentication tokens and certificates to connect to the broker. To deploy the MQTT client, run the following command:
kubectl apply -f https://raw.githubusercontent.com/Azure-Samples/explore-iot-operations/main/samples/quickstarts/mqtt-client.yaml
Send temperature messages
In the first terminal session, create and run a script to send temperature data in Fahrenheit:
# Connect to the MQTT client pod
kubectl exec --stdin --tty mqtt-client -n azure-iot-operations -- sh -c '
# Create and run temperature.sh from within the MQTT client pod
while true; do
  # Generate a random temperature value between 0 and 6000 Fahrenheit
  random_value=$(shuf -i 0-6000 -n 1)
  payload="{\"temperature\":{\"value\":$random_value,\"unit\":\"F\"}}"

  echo "Publishing temperature: $payload"

  # Publish to the input topic
  mosquitto_pub -h aio-broker -p 18883 \
    -m "$payload" \
    -t "sensor/temperature/raw" \
    -d \
    --cafile /var/run/certs/ca.crt \
    -D PUBLISH user-property __ts $(date +%s)000:0:df \
    -D CONNECT authentication-method 'K8S-SAT' \
    -D CONNECT authentication-data $(cat /var/run/secrets/tokens/broker-sat)

  sleep 1
done'
Note
The MQTT user property __ts is used to add a timestamp to the messages to ensure the timely processing of messages using the Hybrid Logical Clock (HLC). Having the timestamp helps the data flow to decide whether to accept or drop the message. The format of the property is <timestamp>:<counter>:<nodeid>. It makes the data flow processing more accurate, but isn't mandatory.
The script publishes random temperature data to the sensor/temperature/raw topic every second. It should look like this:
Publishing temperature: {"temperature":{"value":1234,"unit":"F"}}
Publishing temperature: {"temperature":{"value":5678,"unit":"F"}}
Leave the script running to continue publishing temperature data.
Subscribe to processed messages
In the second terminal session (also connected to the MQTT client pod), subscribe to the output topic to see the converted temperature values:
# Connect to the MQTT client pod
kubectl exec --stdin --tty mqtt-client -n azure-iot-operations -- sh -c '
mosquitto_sub -h aio-broker -p 18883 -t "sensor/temperature/processed" --cafile /var/run/certs/ca.crt \
-D CONNECT authentication-method "K8S-SAT" \
-D CONNECT authentication-data "$(cat /var/run/secrets/tokens/broker-sat)"'
You see the temperature data converted from Fahrenheit to Celsius by the WASM module.
{"temperature":{"value":1292.2222222222222,"count":0,"max":0.0,"min":0.0,"average":0.0,"last":0.0,"unit":"C","overtemp":false}}
{"temperature":{"value":203.33333333333334,"count":0,"max":0.0,"min":0.0,"average":0.0,"last":0.0,"unit":"C","overtemp":false}}
Example 2: Deploy a complex graph
This example demonstrates a sophisticated data processing workflow that handles multiple data types including temperature, humidity, and image data. The complex graph definition orchestrates multiple WASM modules to perform advanced analytics and object detection.
How it works
The complex graph processes three data streams and combines them into enriched sensor analytics:
- Temperature processing: Converts Fahrenheit to Celsius, filters invalid readings, and calculates statistics
- Humidity processing: Accumulates humidity measurements over time intervals
- Image processing: Performs object detection on camera snapshots and formats results
For detailed information about how the complex graph definition works, its structure, and the data flow through multiple processing stages, see Example 2: Complex graph definition.
The graph uses specialized modules from the Rust examples.
Configure the complex data flow graph
This configuration implements the multi-sensor processing workflow using the graph-complex:1.0.0 artifact. Notice how the data flow graph deployment is similar to Example 1 - both use the same three-node pattern (source, graph processor, destination) even though the processing logic is different.
This similarity occurs because the data flow graph resource acts as a host environment that loads and executes graph definitions. The actual processing logic resides in the graph definition artifact (graph-simple:1.0.0 vs graph-complex:1.0.0), which contains the YAML specification of operations and connections between WASM modules. The data flow graph resource provides the runtime infrastructure to pull the artifact, instantiate the modules, and route data through the defined workflow.
To create a data flow graph in operations experience, go to Data flow tab.
Select the drop-down menu next to + Create and select Create a data flow graph
Select the placeholder name new-data-flow to set the data flow properties. Enter the name of the data flow graph and choose the data flow profile to use.
In the data flow diagram, select Source to configure the source node. Under Source details, select Asset or Data flow Endpoint.
If you select Asset, choose the asset to pull data from and click Apply.
If you select Data flow Endpoint, enter the following details and click Apply.
Setting Description Data flow endpoint Select default to use the default MQTT message broker endpoint. Topic The topic filter to subscribe to for incoming messages. Use Topic(s) > Add row to add multiple topics. Message schema The schema to use to deserialize the incoming messages.
In the data flow diagram, select Add graph transform (optional) to add a graph processing node. In the Graph selection pane, select graph-complex:1 and click Apply.
Important
This example uses the
graph-complex:1.0.0artifact that you pushed to your container registry. You can create your custom graphs by developing your own WASM modules and pushing them to your container registry. The graphs you push to your container registry are available in the Graph selection pane.You can configure some graph operator settings by selecting the graph node in the diagram.
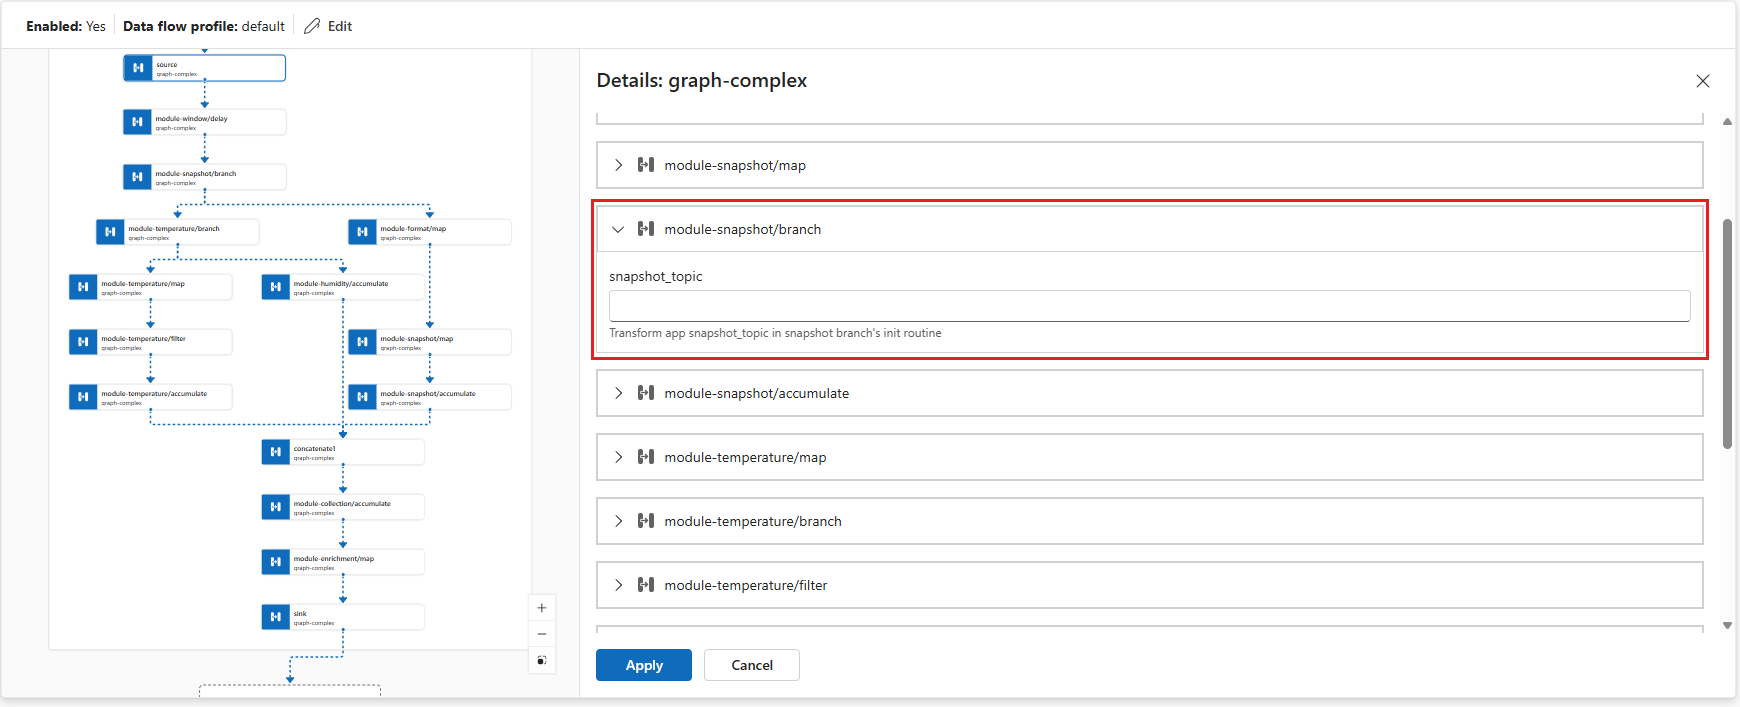
Operator Description module-snapshot/branch Configures the snapshotmodule to perform object detection on images. You can set thesnapshot_topicconfiguration key to specify the input topic for image data.module-temperature/map Transforms key2temperature values to a different scale.Click Apply to save the changes.
In the data flow diagram, select Destination to configure the destination node.
Select Save under the data flow graph name to save the data flow graph.
Test the complex data flow
Before we can see the output, we need to get the source data setup.
Upload RAW image files to the mqtt-client pod
The image files are for the snapshot module to detect objects in the images. They're located in the images folder on GitHub.
First, clone the repository to get access to the image files:
git clone https://github.com/Azure-Samples/explore-iot-operations.git
cd explore-iot-operations
To upload RAW image files from the ./samples/wasm/images folder to the mqtt-client pod, you can use the following command:
kubectl cp ./samples/wasm/images azure-iot-operations/mqtt-client:/tmp
Check the files are uploaded:
kubectl exec -it mqtt-client -n azure-iot-operations -- ls /tmp/images
You should see the list of files in the /tmp/images folder.
beaker.raw          laptop.raw          sunny2.raw
binoculars.raw      lawnmower.raw       sunny4.raw
broom.raw           milkcan.raw         thimble.raw
camera.raw          photocopier.raw     tripod.raw
computer_mouse.raw  radiator.raw        typewriter.raw
daisy3.raw          screwdriver.raw     vacuum_cleaner.raw
digital_clock.raw   sewing_machine.raw
hammer.raw          sliding_door.raw
Publish simulated temperature, humidity data, and send images
You can combine the commands for publishing temperature, humidity data, and sending images into a single script. Use the following command:
# Connect to the MQTT client pod and run the script
kubectl exec --stdin --tty mqtt-client -n azure-iot-operations -- sh -c '
while true; do
  # Generate a random temperature value between 0 and 6000
  temp_value=$(shuf -i 0-6000 -n 1)
  temp_payload="{\"temperature\":{\"value\":$temp_value,\"unit\":\"F\"}}"
  echo "Publishing temperature: $temp_payload"
  mosquitto_pub -h aio-broker -p 18883 \
    -m "$temp_payload" \
    -t "sensor/temperature/raw" \
    --cafile /var/run/certs/ca.crt \
    -D CONNECT authentication-method "K8S-SAT" \
    -D CONNECT authentication-data "$(cat /var/run/secrets/tokens/broker-sat)" \
    -D PUBLISH user-property __ts $(date +%s)000:0:df

  # Generate a random humidity value between 30 and 90
  humidity_value=$(shuf -i 30-90 -n 1)
  humidity_payload="{\"humidity\":{\"value\":$humidity_value}}"
  echo "Publishing humidity: $humidity_payload"
  mosquitto_pub -h aio-broker -p 18883 \
    -m "$humidity_payload" \
    -t "sensor/humidity/raw" \
    --cafile /var/run/certs/ca.crt \
    -D CONNECT authentication-method "K8S-SAT" \
    -D CONNECT authentication-data "$(cat /var/run/secrets/tokens/broker-sat)" \
    -D PUBLISH user-property __ts $(date +%s)000:0:df

  # Send an image every 2 seconds
  if [ $(( $(date +%s) % 2 )) -eq 0 ]; then
    file=$(ls /tmp/images/*.raw | shuf -n 1)
    echo "Sending file: $file"
    mosquitto_pub -h aio-broker -p 18883 \
      -f $file \
      -t "sensor/images/raw" \
      --cafile /var/run/certs/ca.crt \
      -D CONNECT authentication-method "K8S-SAT" \
      -D CONNECT authentication-data "$(cat /var/run/secrets/tokens/broker-sat)" \
      -D PUBLISH user-property __ts $(date +%s)000:0:df
  fi

  # Wait for 1 second before the next iteration
  sleep 1
done'
Check the output
In a new terminal, subscribe to the output topic:
kubectl exec --stdin --tty mqtt-client -n azure-iot-operations -- sh -c '
mosquitto_sub -h aio-broker -p 18883 -t "analytics/sensor/processed" --cafile /var/run/certs/ca.crt \
-D CONNECT authentication-method "K8S-SAT" \
-D CONNECT authentication-data "$(cat /var/run/secrets/tokens/broker-sat)"'
The output should look like this
{"temperature":[{"count":9,"max":2984.4444444444443,"min":248.33333333333337,"average":1849.6296296296296,"last":2612.222222222222,"unit":"C","overtemp":true}],"humidity":[{"count":10,"max":76.0,"min":30.0,"average":49.7,"last":38.0}],"object":[{"result":"milk can; broom; screwdriver; binoculars, field glasses, opera glasses; toy terrier"}]}
{"temperature":[{"count":10,"max":2490.5555555555557,"min":430.55555555555554,"average":1442.6666666666667,"last":1270.5555555555557,"unit":"C","overtemp":true}],"humidity":[{"count":9,"max":87.0,"min":34.0,"average":57.666666666666664,"last":42.0}],"object":[{"result":"broom; Saint Bernard, St Bernard; radiator"}]}
Here, the output contains the temperature and humidity data, as well as the detected objects in the images.
Develop custom WASM modules
To create custom data processing logic for your data flow graphs, develop WebAssembly modules in Rust or Python. Custom modules enable you to implement specialized business logic, data transformations, and analytics that aren't available in the built-in operators.
For comprehensive development guidance including:
- Setting up your development environment
- Creating operators in Rust and Python
- Understanding the data model and interfaces
- Building and testing your modules
See Develop WebAssembly modules for data flow graphs.
For detailed information about creating and configuring the YAML graph definitions that define your data processing workflows, see Configure WebAssembly graph definitions.
Configuration of custom data flow graphs
This section provides detailed information about configuring data flow graphs with WASM modules. It covers all configuration options, data flow endpoints, and advanced settings.
Data flow graph overview
A data flow graph defines how data flows through WebAssembly modules for processing. Each graph consists of:
- Mode that controls whether the graph is enabled or disabled
- Profile reference that links to a data flow profile defining scaling and resource settings
- Disk persistence that optionally enables persistent storage for graph state
- Nodes that define the source, processing, and destination components
- Node connections that specify how data flows between nodes
Mode configuration
The mode property determines whether the data flow graph is actively processing data. You can set the mode to Enabled or Disabled (case-insensitive). When disabled, the graph stops processing data but retains its configuration.
When creating or editing a data flow graph, in the Data flow properties pane, you can check Enable data flow to Yes to set the mode to Enabled. If you leave it unchecked, the mode is set to Disabled.

Profile reference
The profile reference connects your data flow graph to a data flow profile, which defines scaling settings, instance counts, and resource limits. If you don't specify a profile reference, you must use a Kubernetes owner reference instead. Most scenarios use the default profile provided by Azure IoT Operations.
When creating or editing a data flow graph, in the Data flow properties pane, select the data flow profile. The default data flow profile is selected by default. For more information on data flow profiles, see Configure data flow profile.
Important
You can only choose the data flow profile when creating a data flow graph. You can't change the data flow profile after the data flow graph is created. If you want to change the data flow profile of an existing data flow graph, delete the original data flow graph and create a new one with the new data flow profile.
Request disk persistence
Important
There is a known issue with disk persistence for data flow graphs. This feature is currently not working as expected. For more information, see Known issues.
Request disk persistence allows data flow graphs to maintain state across restarts. When you enable this feature, the graph can recover processing state if connected broker restarts. This feature is useful for stateful processing scenarios where losing intermediate data would be problematic. When you enable request disk persistence, the broker persists the MQTT data, like messages in the subscriber queue, to disk. This approach ensures that your data flow's data source won't experience data loss during power outages or broker restarts. The broker maintains optimal performance because persistence is configured per data flow, so only the data flows that need persistence use this feature.
The data flow graph makes this persistence request during subscription using an MQTTv5 user property. This feature only works when:
- The data flow uses the MQTT broker as a source (source node with MQTT endpoint)
- The MQTT broker has persistence enabled with dynamic persistence mode set to
Enabledfor the data type, like subscriber queues
This configuration allows MQTT clients like data flow graphs to request disk persistence for their subscriptions using MQTTv5 user properties. For detailed MQTT broker persistence configuration, see Configure MQTT broker persistence.
The setting accepts Enabled or Disabled, with Disabled as the default.
When creating or editing a data flow graph, in the Data flow properties pane, you can check Request data persistence to Yes to set the request disk persistence to Enabled. If you leave it unchecked, the setting is Disabled.
Node configuration
Nodes are the building blocks of a data flow graph. Each node has a unique name within the graph and performs a specific function. There are three types of nodes:
Source nodes
Source nodes define where data enters the graph. They connect to data flow endpoints that receive data from MQTT brokers or Kafka topics. Each source node must specify:
- Endpoint reference that points to a configured data flow endpoint
- Data sources as a list of MQTT topics or Kafka topics to subscribe to
- Asset reference (optional) that links to an Azure Device Registry asset for schema inference
The data sources array allows you to subscribe to multiple topics without modifying the endpoint configuration. This flexibility enables endpoint reuse across different data flows.
Note
Currently, only MQTT and Kafka endpoints are supported as data sources for data flow graphs. For more information, see Configure data flow endpoints.
In the data flow diagram, select Source to configure the source node. Under Source details, select Data flow Endpoint, then use the Topic(s) field to specify the MQTT topic filters to subscribe to for incoming messages. You can add multiple MQTT topics by selecting Add row and entering a new topic.
Graph processing nodes
Graph processing nodes contain the WebAssembly modules that transform data. These nodes pull WASM artifacts from container registries and execute them with specified configuration parameters. Each graph node requires:
- Registry endpoint reference that points to a registry endpoint for pulling artifacts
- Artifact specification that defines the module name and version to pull
- Configuration parameters as key-value pairs passed to the WASM module
The configuration array allows you to customize module behavior without rebuilding the WASM artifact. Common configuration options include processing parameters, thresholds, conversion settings, and feature flags.
In the data flow diagram, select Add graph transform (optional) to add a graph processing node. In the Graph selection pane, select the desired graph artifact, either simple or complex graph, and click Apply. You can configure some graph operator settings by selecting the graph node in the diagram.
The configuration key-value pairs are passed to the WASM module at runtime. The module can access these values to customize its behavior. This approach allows you to:
- Deploy the same WASM module with different configurations
- Adjust processing parameters without rebuilding modules
- Enable or disable features based on deployment requirements
- Set environment-specific values like thresholds or endpoints
Destination nodes
Destination nodes define where processed data is sent. They connect to data flow endpoints that send data to MQTT brokers, cloud storage, or other systems. Each destination node specifies:
- Endpoint reference that points to a configured data flow endpoint
- Data destination as the specific topic, path, or location for output data
- Output schema settings (optional) that define serialization format and schema validation
For storage destinations like Azure Data Lake or Fabric OneLake, you can specify output schema settings to control how data is serialized and validated.
Note
Currently, only MQTT, Kafka, and OpenTelemetry endpoints are supported as data destinations for data flow graphs. For more information, see Configure data flow endpoints.
- In the data flow diagram, select the Destination node.
- Select the desired data flow endpoint from the Data flow endpoint details dropdown.
- Select Proceed to configure the destination.
- Enter the required settings for the destination, including the topic or table to send the data to. The data destination field is automatically interpreted based on the endpoint type. For example, if the data flow endpoint is an MQTT endpoint, the destination details page prompts you to enter the topic.
Node connections
Node connections define the data flow path between nodes. Each connection specifies a source node and destination node, creating the processing pipeline. Connections can optionally include schema validation to ensure data integrity between processing stages.
When you specify schema validation, the system validates data format and structure as it flows between nodes. The validation helps catch data inconsistencies early and ensures WASM modules receive data in the expected format.
The operations experience automatically creates node connections when you select the graph processing node. You can't modify the connections after the graph is created.
Data flow endpoints
Data flow graphs connect to external systems through data flow endpoints. The type of endpoint determines whether it can be used as a source, destination, or both:
MQTT endpoints
MQTT endpoints can serve as both sources and destinations. They connect to MQTT brokers including:
- Azure IoT Operations local MQTT broker (required in every data flow)
- Azure Event Grid MQTT
- Custom MQTT brokers
For detailed configuration information, see Configure MQTT data flow endpoints.
Kafka endpoints
Kafka endpoints can serve as both sources and destinations. They connect to Kafka-compatible systems including:
- Azure Event Hubs (Kafka-compatible)
- Apache Kafka clusters
- Confluent Cloud
For detailed configuration information, see Configure Azure Event Hubs and Kafka data flow endpoints.
Storage endpoints
Storage endpoints can only serve as destinations. They connect to cloud storage systems for long-term data retention and analytics:
- Azure Data Lake Storage
- Microsoft Fabric OneLake
- Local storage
Storage endpoints typically require output schema settings to define data serialization format.
Registry endpoints
Registry endpoints provide access to container registries for pulling WASM modules and graph definitions. They're not used directly in data flow but graph processing nodes reference them.
For detailed configuration information, see Configure registry endpoints.
Related content
- Configure WebAssembly graph definitions
- Develop WebAssembly modules for data flow graphs
- Configure registry endpoints
- Configure MQTT data flow endpoints
- Configure Azure Event Hubs and Kafka data flow endpoints
- Configure Azure Data Lake Storage data flow endpoints
- Configure Microsoft Fabric OneLake data flow endpoints