Note
Access to this page requires authorization. You can try signing in or changing directories.
Access to this page requires authorization. You can try changing directories.
Application Insights is a service that monitors the performance, availability, and usage of your web applications. It can help you identify and diagnose problems, analyze user behavior, and track key metrics. This article describes some of the features of Application Insights that are useful for multitenant systems. It also describes various tenancy models.
Tip
Application Insights is designed and optimized for monitoring solutions. It's not intended to be used to capture every event that happens in a system, which is a task that you might need to do for auditing or billing. To learn about how you can measure usage for billing purposes, see Measure the consumption of each tenant.
Isolation models
When you implement a multitenant system that uses Application Insights, you need to determine the required level of isolation. There are several isolation models that you can choose from. The following factors might influence your choice:
- The number of tenants that you plan to have.
- Whether you share your application tier among multiple tenants or deploy separate deployment stamps for each tenant.
- Whether you or your customers are sensitive about storing data alongside other tenants' data.
- Whether you want to approach tenancy differently in different tiers. For example, the application tier of your solution can be multitenant while the data tier is single tenant.
- Whether telemetry requirements vary among tenants.
Tip
The main factors that determine the cost of Application Insights are the amount of data that you send to it and how long the data is retained. In a multitenant application, the overall cost is the same for a dedicated Application Insights instance as it is for a shared instance. For more information, see Azure Monitor pricing.
The following table summarizes the differences between the main tenancy models for Application Insights:
| Consideration | Globally shared Application Insights instance | One Application Insights instance for each region or stamp | One Application Insights instance for each tenant |
|---|---|---|---|
| Data isolation | Low | Low | High |
| Performance isolation | Low | Medium | High |
| Deployment complexity | Low to medium, depending on the number of tenants | Medium, depending on the number of tenants | High |
| Operational complexity | Low | Medium | High |
| Example scenario | Large multitenant solution that has a shared application tier | Multitenant solution that has regional deployments to better serve a global customer base | Individual application instances for each tenant |
Globally shared Application Insights instance
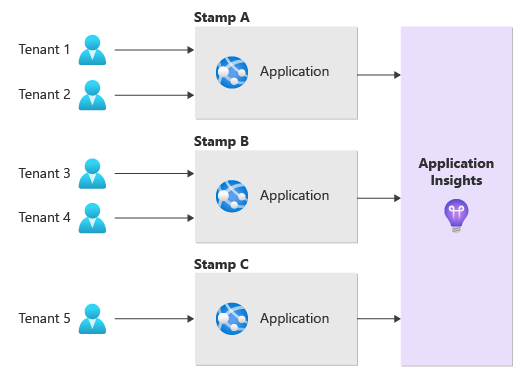
You can use a single instance of Application Insights to track telemetry for tenants in a multitenant application.
One benefit of this approach is simplified configuration and management of the application. You only need to instrument the application code one time. Drawbacks of this approach include the limits and quotas that are associated with a single Application Insights instance. To determine whether limits might affect your multitenant application, see Application Insights limits.
When you use a shared Application Insights resource, it might also be more difficult to isolate and filter the data for each tenant, especially if you have many tenants. All tenants share the same Log Analytics workspace and instrumentation keys, so security and privacy might also be a concern.
To address these concerns, you might need to implement logic and mechanisms to ensure that you can filter data by tenant and that your operations team can properly see per-tenant data. You can implement filtering by adding a custom property to capture the tenant ID as part of every telemetry item. You can then use the tenant ID to query the data.
One Application Insights instance for each stamp
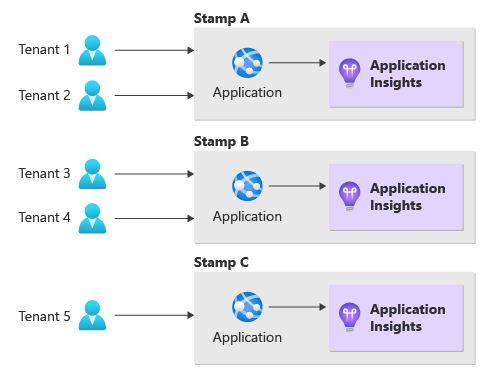
Multitenant solutions often include multiple stamps, which might be deployed in different Azure regions. Stamps enable you to serve tenants that are local to a specific region so you can provide better performance. A single stamp might serve a single tenant or a subset of your tenants. To learn more about stamps, see Deployment stamps pattern.
You might decide to deploy an Application Insights instance in each stamp and share the instance among all tenants that use the stamp. The following diagram illustrates this approach.
This approach provides more flexibility with resource limits because the limits apply to each instance of Application Insights.
One Application Insights instance for each tenant
You might decide to use a dedicated Application Insights instance for each tenant. The following diagram illustrates this approach.
This approach gives you more flexibility and control over tenants' telemetry data and provides the strongest data isolation. When you use this model, you can configure tenant-specific settings and retention policies.
When you use this approach, you need to deploy several Application Insights instances, manage tenant-specific settings in a tenant catalog, and change application code when new tenants are onboarded. The decision to deploy a dedicated Application Insights instance for each tenant is separate from the decision to deploy an application tier for each tenant. For example, you can decide to deploy a single application instance in a stamp that multiple tenants share but deploy one Application Insights instance for each tenant.
You should consider using one Application Insights instance for each tenant if any of the following conditions apply:
- You require a high degree of data isolation between your tenants.
- You need different configurations for various tenants.
- The service limits of a single Application Insights instance don't meet your needs.
This approach makes it difficult to aggregate and compare data across tenants because you must query multiple Application Insights instances separately. If you use this approach, consider using cross-resource queries and Azure Monitor workbooks.
Application Insights features that support multitenancy
You can use the following Application Insights features to support multitenancy in your workloads.
Custom properties and metrics
Application Insights provides a way to enrich telemetry data by using custom properties and metrics. Custom properties are key-value pairs that you can attach to any telemetry item, such as requests or events. Custom metrics are numerical values that you can track over time, like a score or the length of a queue. You can use custom properties and metrics to add tenant-specific information, like tenant ID, tenant name, tenant location, and deployment stamp ID, to telemetry data.
You can use TelemetryClient or telemetry initializers to add custom properties to your telemetry.
TelemetryClient
TelemetryClient is an object that you can use to track any telemetry item. You can access the custom properties of any telemetry item via its Properties dictionary. The advantage of using TelemetryClient is that you have full control over what custom properties to add, and when to add them. The disadvantage of using TelemetryClient is that you need to access and modify each telemetry item that you want to enrich with custom properties.
Telemetry initializers
You can use telemetry initializers to add information to all telemetry items or to modify properties that the standard telemetry modules set.
When you share an Application Insights instance across multiple tenants, a telemetry initializer often provides a good way to inject the tenant ID into every telemetry item. You can then use the ID to query and filter for reporting. The advantage of using telemetry initializers is that you can apply custom properties to all or some of the telemetry items in one place without needing to write code for each item. The disadvantage of using telemetry initializers is that you have less control over which custom properties to add to each telemetry item, so you might add unnecessary or redundant data.
How to use your telemetry data
When you use either mechanism to add custom properties to telemetry data, you can use features of Application Insights to monitor and analyze multitenant applications in more granular and meaningful ways:
Use Azure Monitor metrics explorer to create charts and graphs that show the performance and usage of the application for each tenant.
Use Log Analytics to write complex queries that filter, aggregate, and join telemetry data based on tenant-specific properties or metrics.
Use alerts to set up rules that notify you when specific conditions are met for a tenant.
Use Azure Monitor workbooks to create interactive reports and dashboards that visualize the health and status of the application for each tenant.
Combine multiple Application Insights instances into a single view
There are several ways to combine data from multiple Application Insights instances. Your choice depends on your needs and preferences. The following sections describe some of the options.
Cross-resource queries
You can use cross-resource queries to query data from multiple Application Insights instances in a single query. The instances can be in a single resource group, in more than one resource group, or in more than one subscription. As the number of Application Insights workspaces in a query increases, query performance might degrade. The number of Application Insights workspaces that you can include in a single query is also limited. For more information, see Query across multiple workspaces and apps.
Azure Monitor workbooks
You can use Azure Monitor workbooks to create interactive reports and dashboards based on data from multiple sources, including Application Insights. These reports and dashboards enable you to visualize and analyze data from multiple Application Insights instances in a single view.
Latency
The time it takes for data on a monitored system to become available for analysis is known as latency. A shared Application Insights instance in a multitenant application doesn't incur more latency than a dedicated one unless the shared instance is throttled and the throttling prevents data from being ingested. In that scenario, latency increases.
Rate limiting on ingestion
You can implement ingestion rate limiting in Application Insights by using sampling to limit the amount of telemetry data that your service ingests each day. Sampling helps prevent Application Insights from throttling telemetry because of ingestion limits. You can use fixed-rate sampling to determine an optimal sampling rate, based on the number of tenants and the daily cap, to stay within the limits.
Contributors
Microsoft maintains this article. The following contributors wrote this article.
Principal author:
- Raj Nemani | Director, Partner Technology Strategist, GPS-ISV
Other contributors:
- Rob Bagby | Principal Content Developer, Azure Patterns & Practices
- John Downs | Principal Software Engineer, Azure Patterns & Practices
- Rick Hallihan | Senior Software Engineer, Azure Patterns & Practices
- Landon Pierce | Customer Engineer, Azure CXP
- Daniel Scott-Raynsford | Senior Partner Technology Strategist, EPS
- Arsen Vladimirskiy | Principal Customer Engineer, Azure CXP
To see nonpublic LinkedIn profiles, sign in to LinkedIn.
Next steps
- Training: Monitor app performance
- What is Application Insights?
- Application Insights limits
- Query across multiple workspaces and apps
- Azure Monitor workbooks
- Capture Application Insights custom metrics with .NET and .NET Core
- Application Insights API for custom events and metrics
- Application Insights telemetry data model
- Azure Monitor pricing
- Log data ingestion time in Azure Monitor
- Sampling in Application Insights
- Filter and preprocess telemetry in the Application Insights SDK


