Note
Access to this page requires authorization. You can try signing in or changing directories.
Access to this page requires authorization. You can try changing directories.
Learn how to view trace results that provide visibility into AI application execution. Use traces to diagnose inaccurate tool calls, misleading prompts, latency bottlenecks, and low-quality evaluation scores.
In this article, you learn how to:
- Enable tracing for a project.
- Instrument the OpenAI SDK.
- Capture message content (optional).
- View trace timelines and spans.
- Connect tracing with evaluation loops.
This article explains how to view trace results for AI applications using OpenAI SDK with OpenTelemetry in Azure AI Foundry.
Prerequisites
You need the following to complete this tutorial:
An Azure AI Foundry project created.
An AI application that uses OpenAI SDK to make calls to models hosted in Azure AI Foundry.
Enable tracing in your project
Azure AI Foundry stores traces in Azure Application Insights using OpenTelemetry. New resources don't provision Application Insights automatically. Associate (or create) a resource once per Azure AI Foundry resource.
The following steps show how to configure your resource:
Go to Azure AI Foundry portal and navigate to your project.
On the side navigation bar, select Tracing.
If an Azure Application Insights resource isn't associated with your Azure AI Foundry resource, associate one. If you already have an Application Insights resource associated, you won't see the enable page below and you can skip this step.
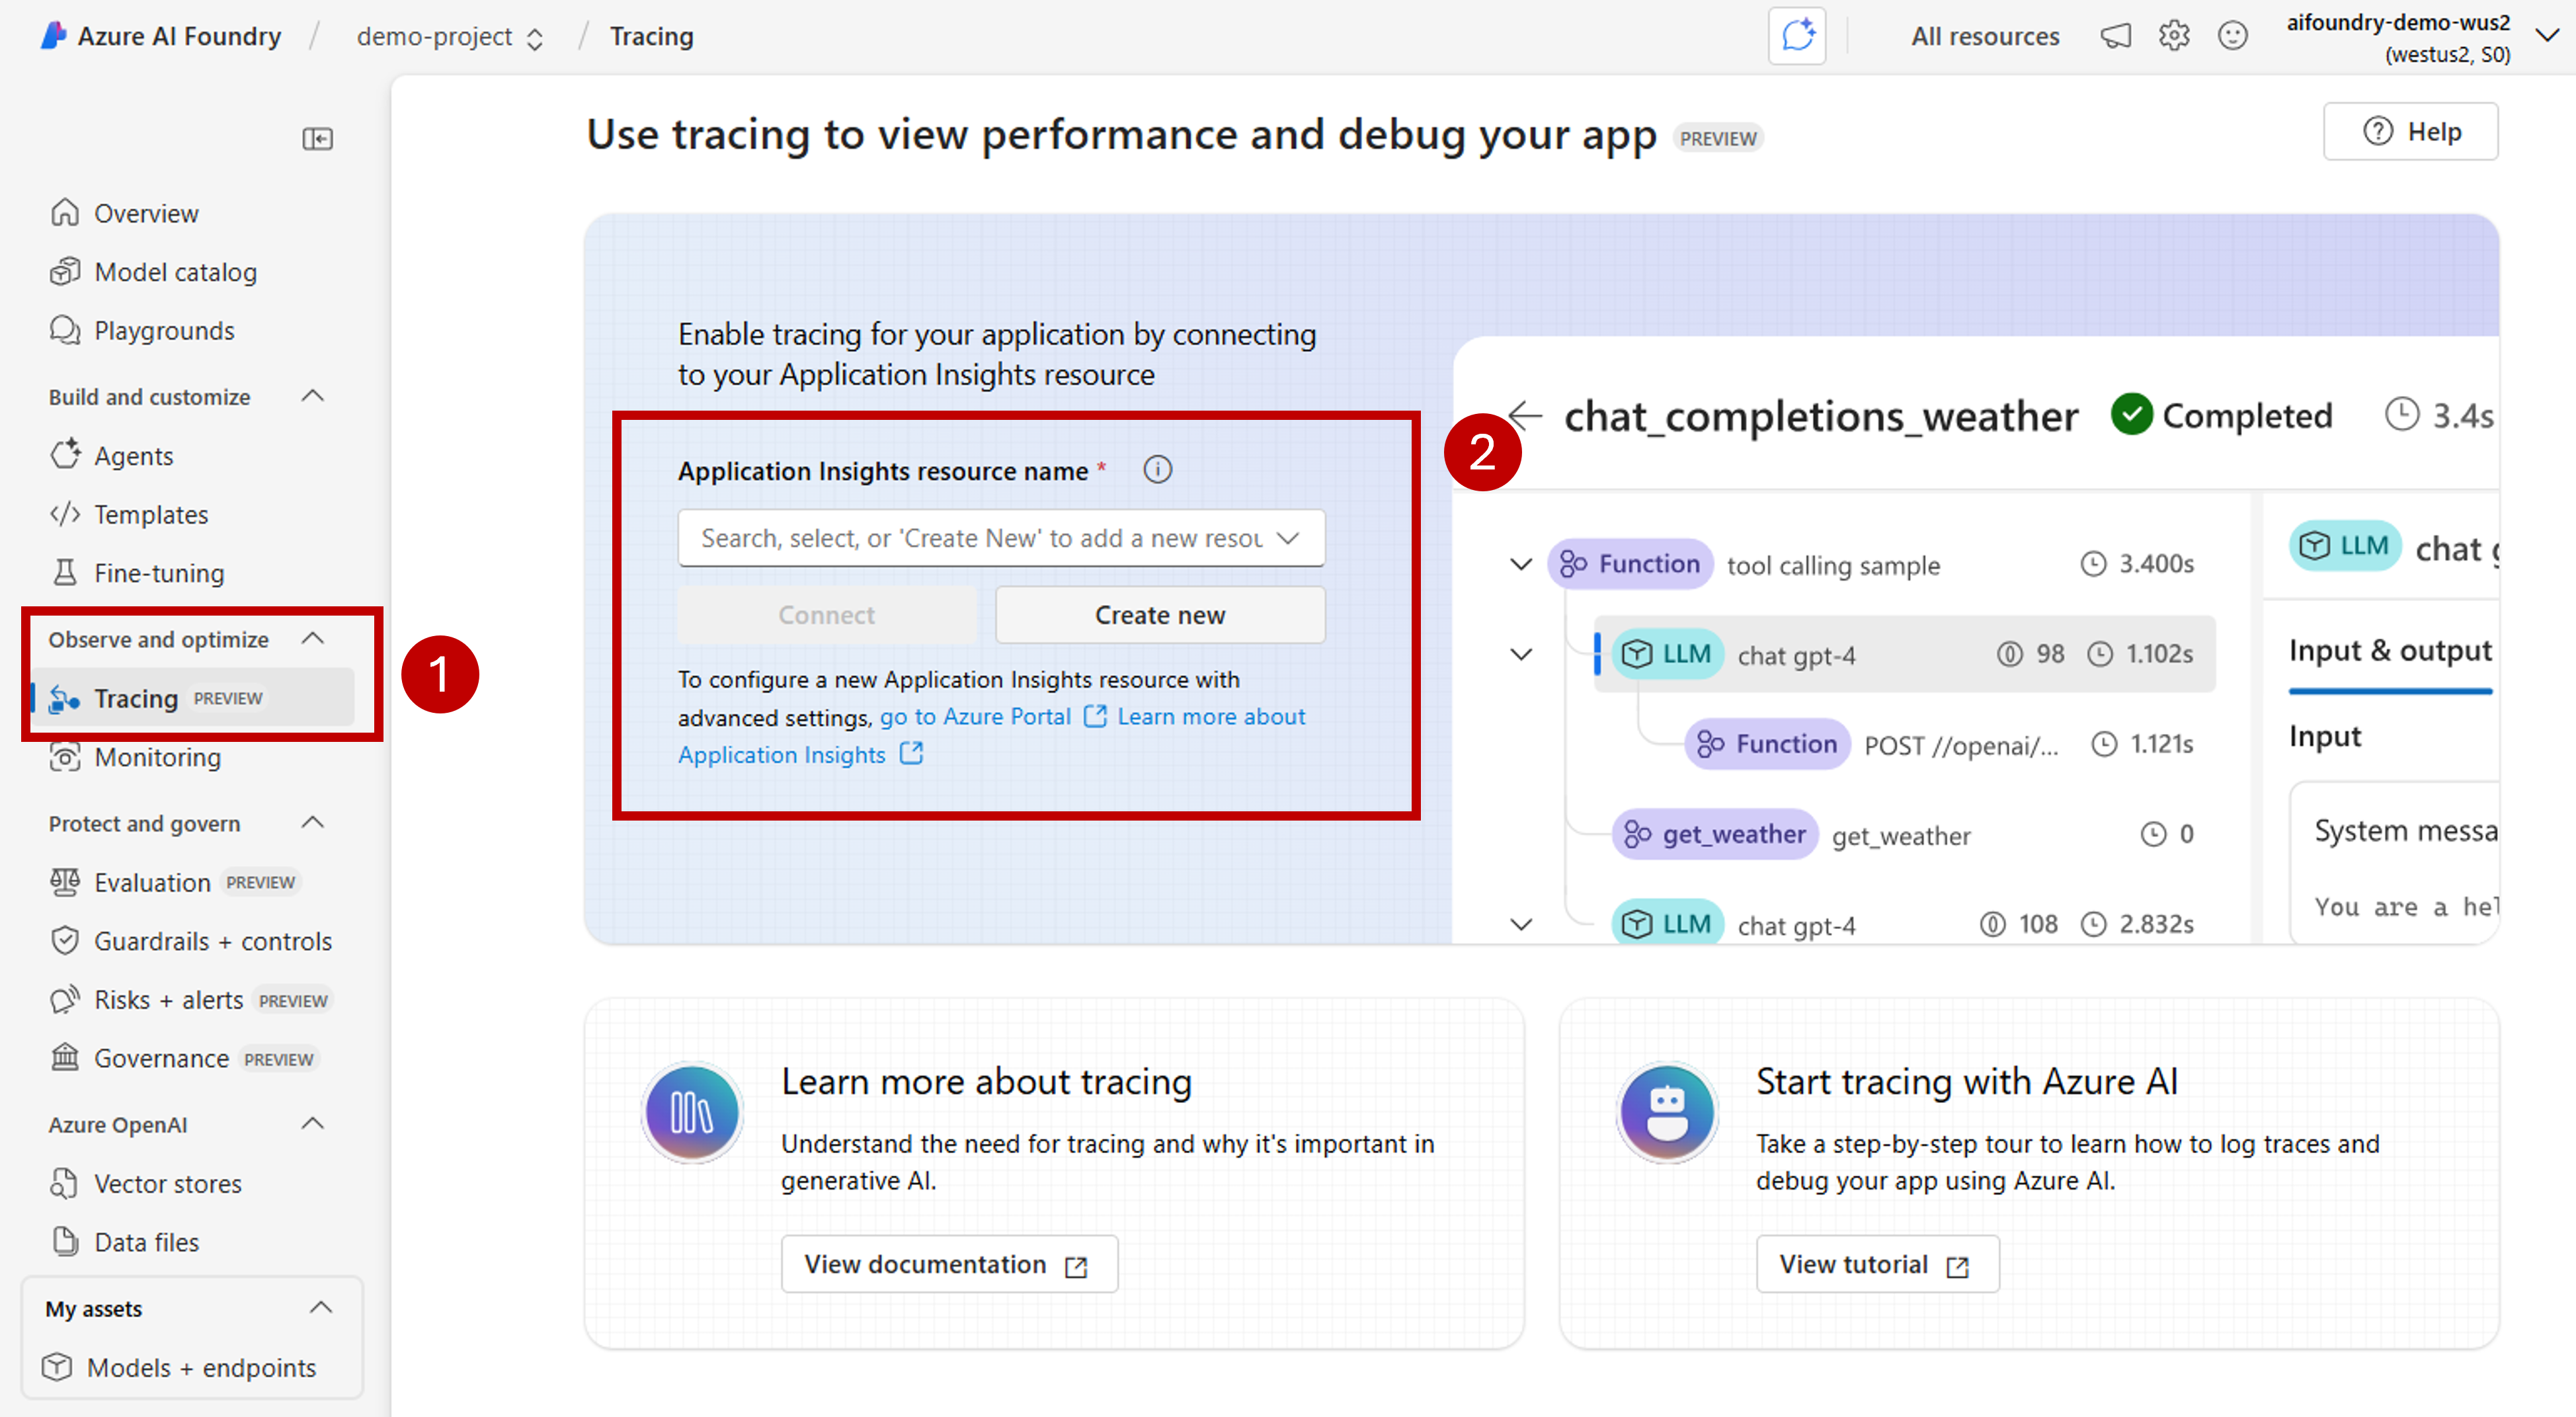
To reuse an existing Azure Application Insights, use the drop-down Application Insights resource name to locate the resource and select Connect.
Tip
To connect to an existing Azure Application Insights, you need at least contributor access to the Azure AI Foundry resource (or Hub).
To connect to a new Azure Application Insights resource, select the option Create new.
Use the configuration wizard to configure the new resource's name.
By default, the new resource is created in the same resource group where the Azure AI Foundry resource was created. Use the Advance settings option to configure a different resource group or subscription.
Tip
To create a new Azure Application Insights resource, you also need contributor role to the resource group you selected (or the default one).
Select Create to create the resource and connect it to the Azure AI Foundry resource.
Once the connection is configured, you're ready to use tracing in any project within the resource.
Tip
Make sure you have the Log Analytics Reader role assigned in your Application Insights resource. To learn more on how to assign roles, see Assign Azure roles using the Azure portal. Use Microsoft Entra groups to more easily manage access for users.
Go to the landing page of your project and copy the project's endpoint URI. You need it later.
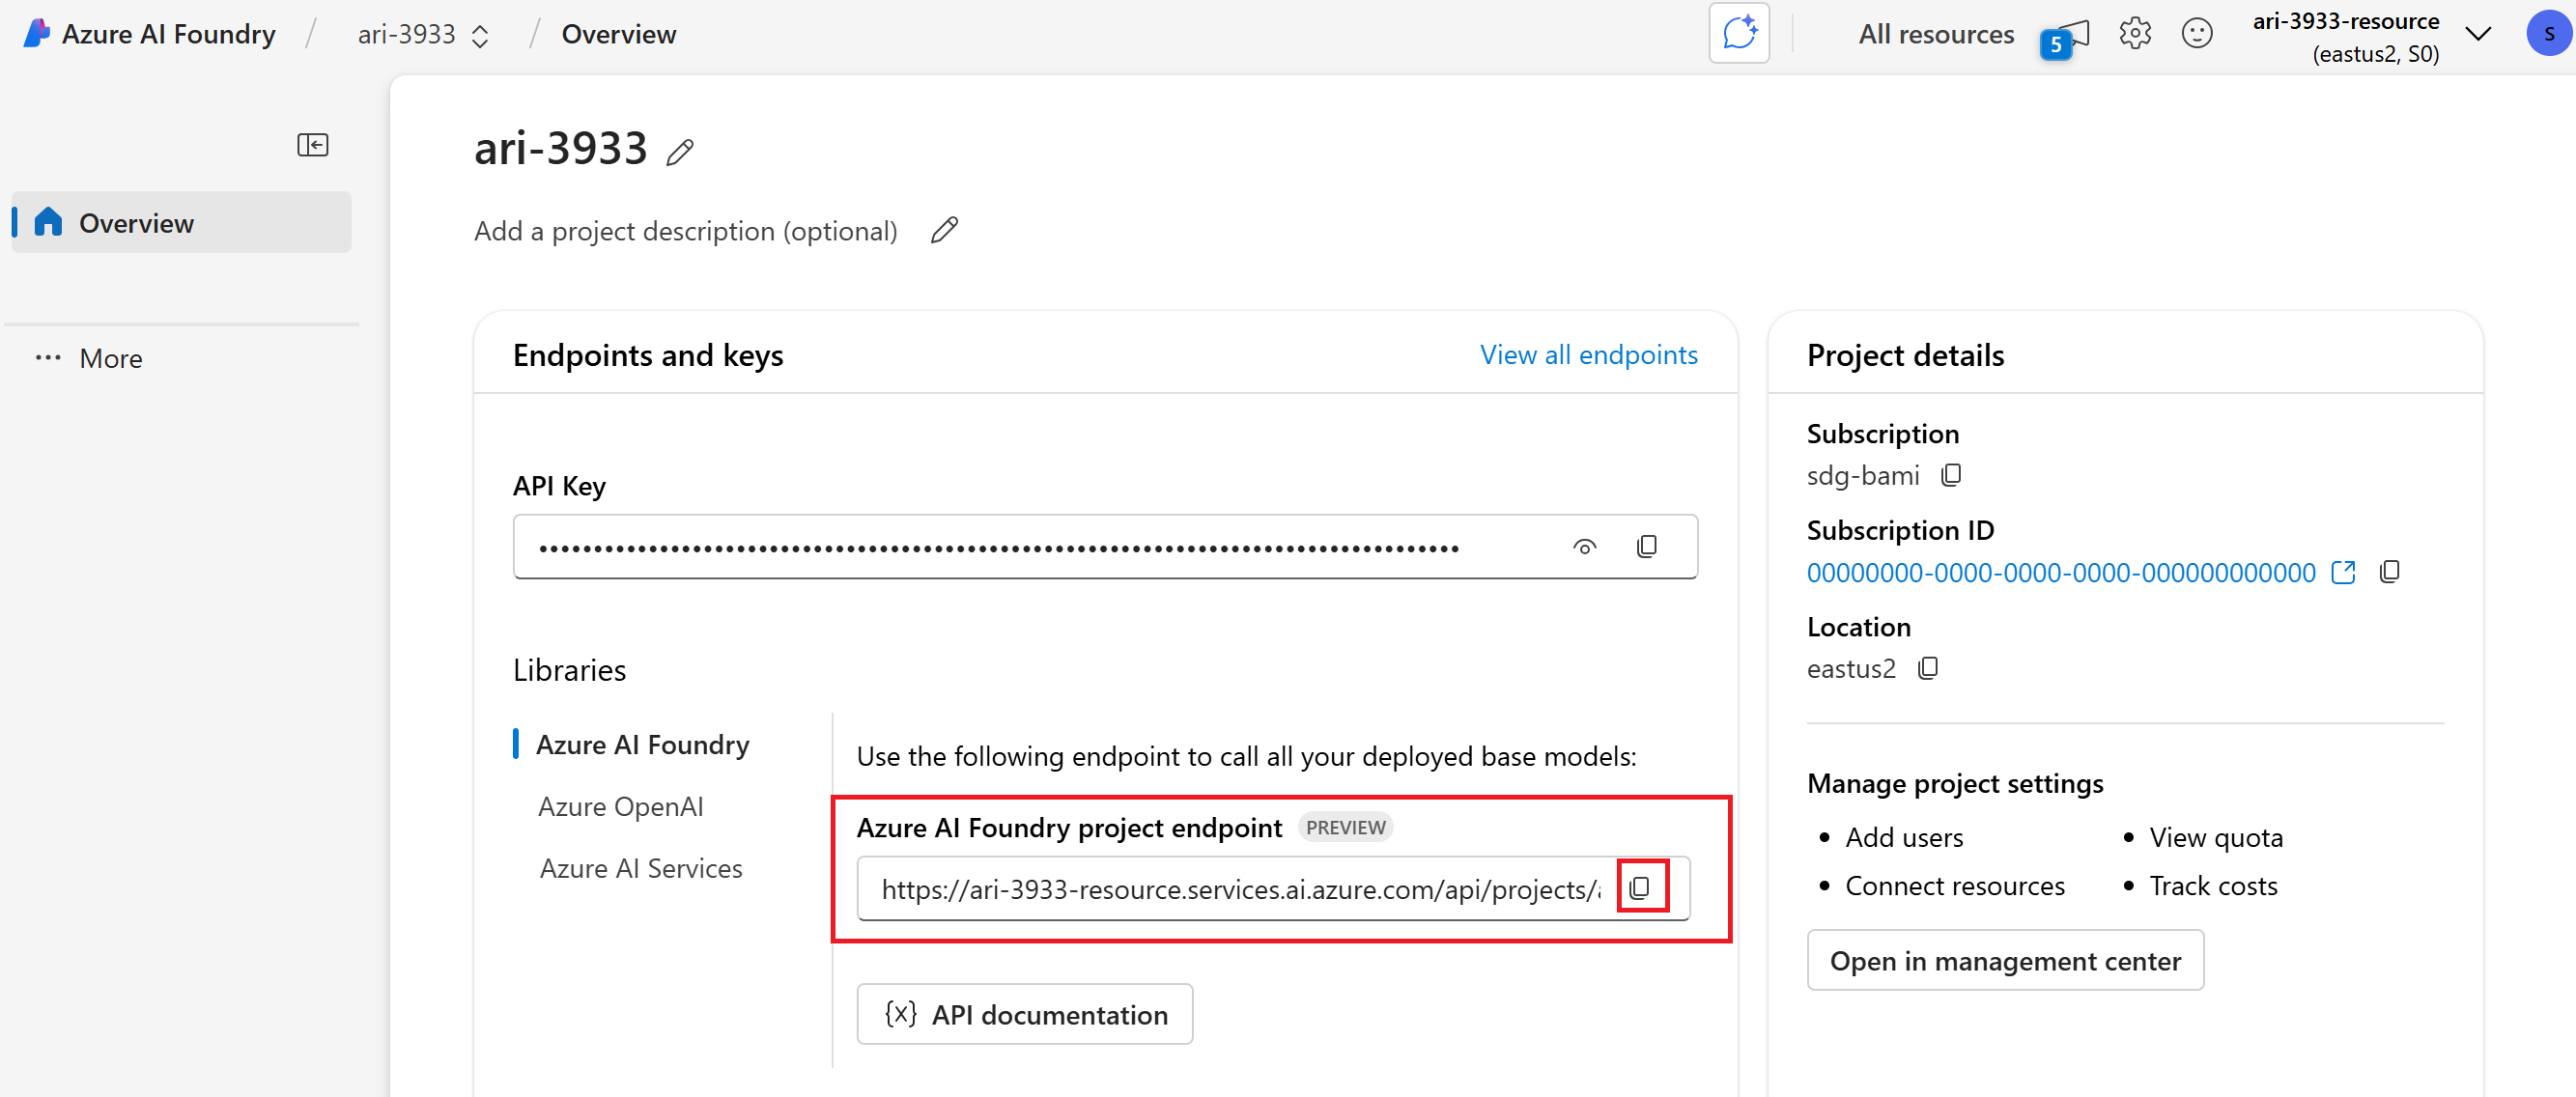
Important
Using a project's endpoint requires configuring Microsoft Entra ID in your application. If you don't have Entra ID configured, use the Azure Application Insights connection string as indicated in step 3 of the tutorial.


View trace results in Azure AI Foundry portal
Once you have tracing configured and your application is instrumented, you can view trace results in the Azure AI Foundry portal:
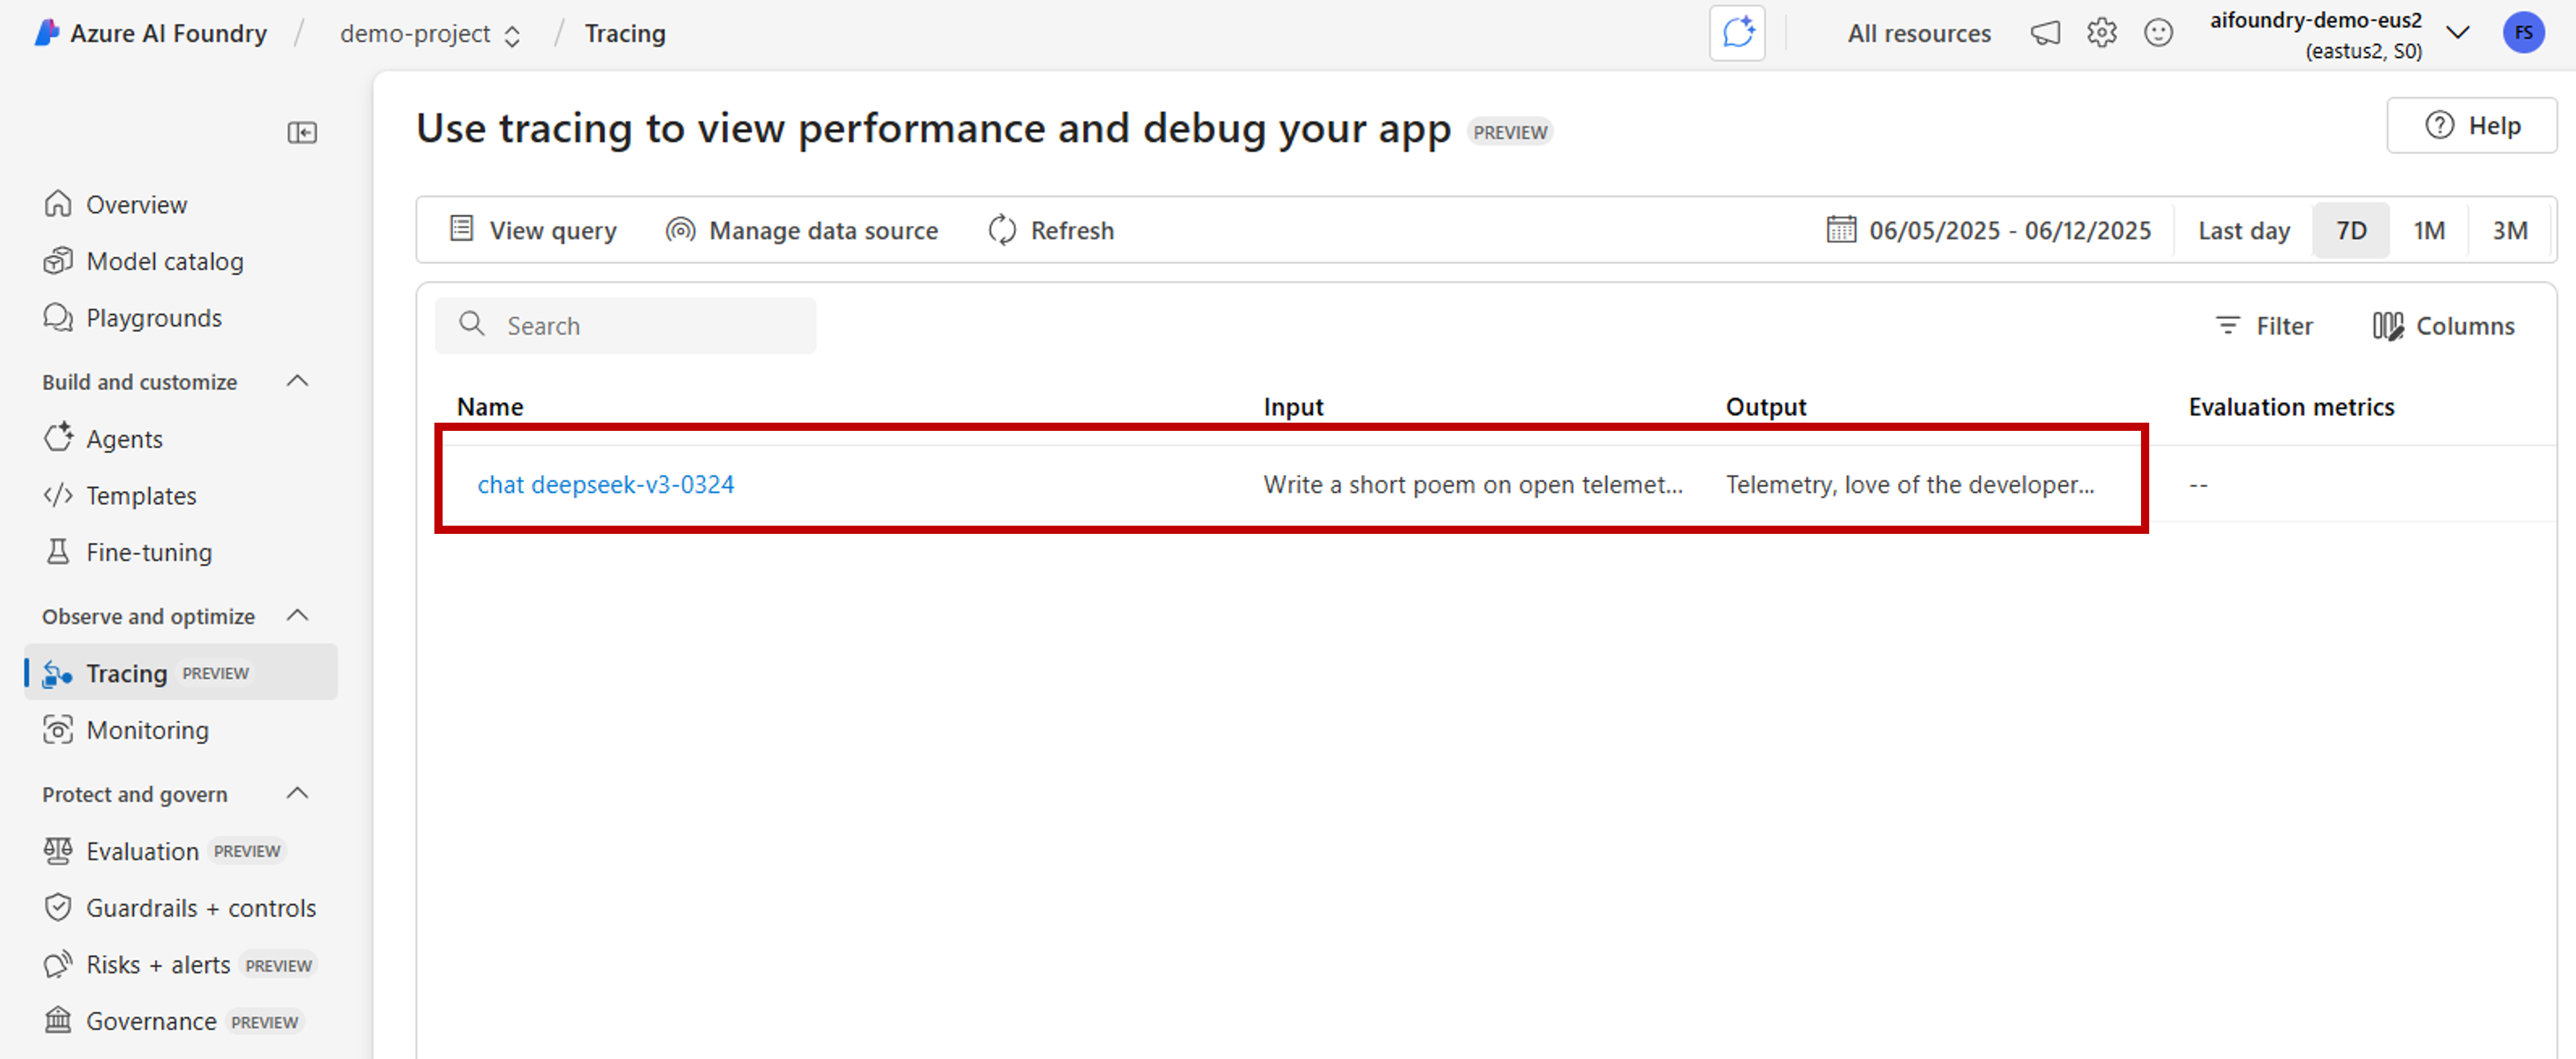
Go to Azure AI Foundry portal and navigate to your project.
On the side navigation bar, select Tracing.
You'll see a list of trace results from your instrumented applications. Each trace shows:
- Trace ID: Unique identifier for the trace
- Start time: When the trace began
- Duration: How long the operation took
- Status: Success or failure status
- Operations: Number of spans in the trace
Select any trace to view detailed trace results including:
- Complete execution timeline
- Input and output data for each operation
- Performance metrics and timing
- Error details if any occurred
- Custom attributes and metadata
Instrument the OpenAI SDK
When developing with the OpenAI SDK, you can instrument your code so traces are sent to Azure AI Foundry. Follow these steps to instrument your code:
Install packages:
pip install azure-ai-projects azure-monitor-opentelemetry opentelemetry-instrumentation-openai-v2(Optional) Capture message content:
- PowerShell:
setx OTEL_INSTRUMENTATION_GENAI_CAPTURE_MESSAGE_CONTENT true - Bash:
export OTEL_INSTRUMENTATION_GENAI_CAPTURE_MESSAGE_CONTENT=true
- PowerShell:
Get the connection string for the linked Application Insights resource (Project > Tracing > Manage data source > Connection string):
from azure.ai.projects import AIProjectClient
from azure.identity import DefaultAzureCredential

project_client = AIProjectClient(
     credential=DefaultAzureCredential(),
     endpoint="https://<your-resource>.services.ai.azure.com/api/projects/<your-project>",
)
connection_string = project_client.telemetry.get_application_insights_connection_string()
Configure Azure Monitor and instrument OpenAI SDK:
from azure.monitor.opentelemetry import configure_azure_monitor
from opentelemetry.instrumentation.openai_v2 import OpenAIInstrumentor

configure_azure_monitor(connection_string=connection_string)
OpenAIInstrumentor().instrument()
Send a request:
client = project_client.get_openai_client()
response = client.chat.completions.create(
     model="gpt-4o-mini",
     messages=[{"role": "user", "content": "Write a short poem on open telemetry."}],
)
print(response.choices[0].message.content)
Return to Tracing in the portal to view new traces.
It might be useful to capture sections of your code that mixes business logic with models when developing complex applications. OpenTelemetry uses the concept of spans to capture sections you're interested in. To start generating your own spans, get an instance of the current tracer object.
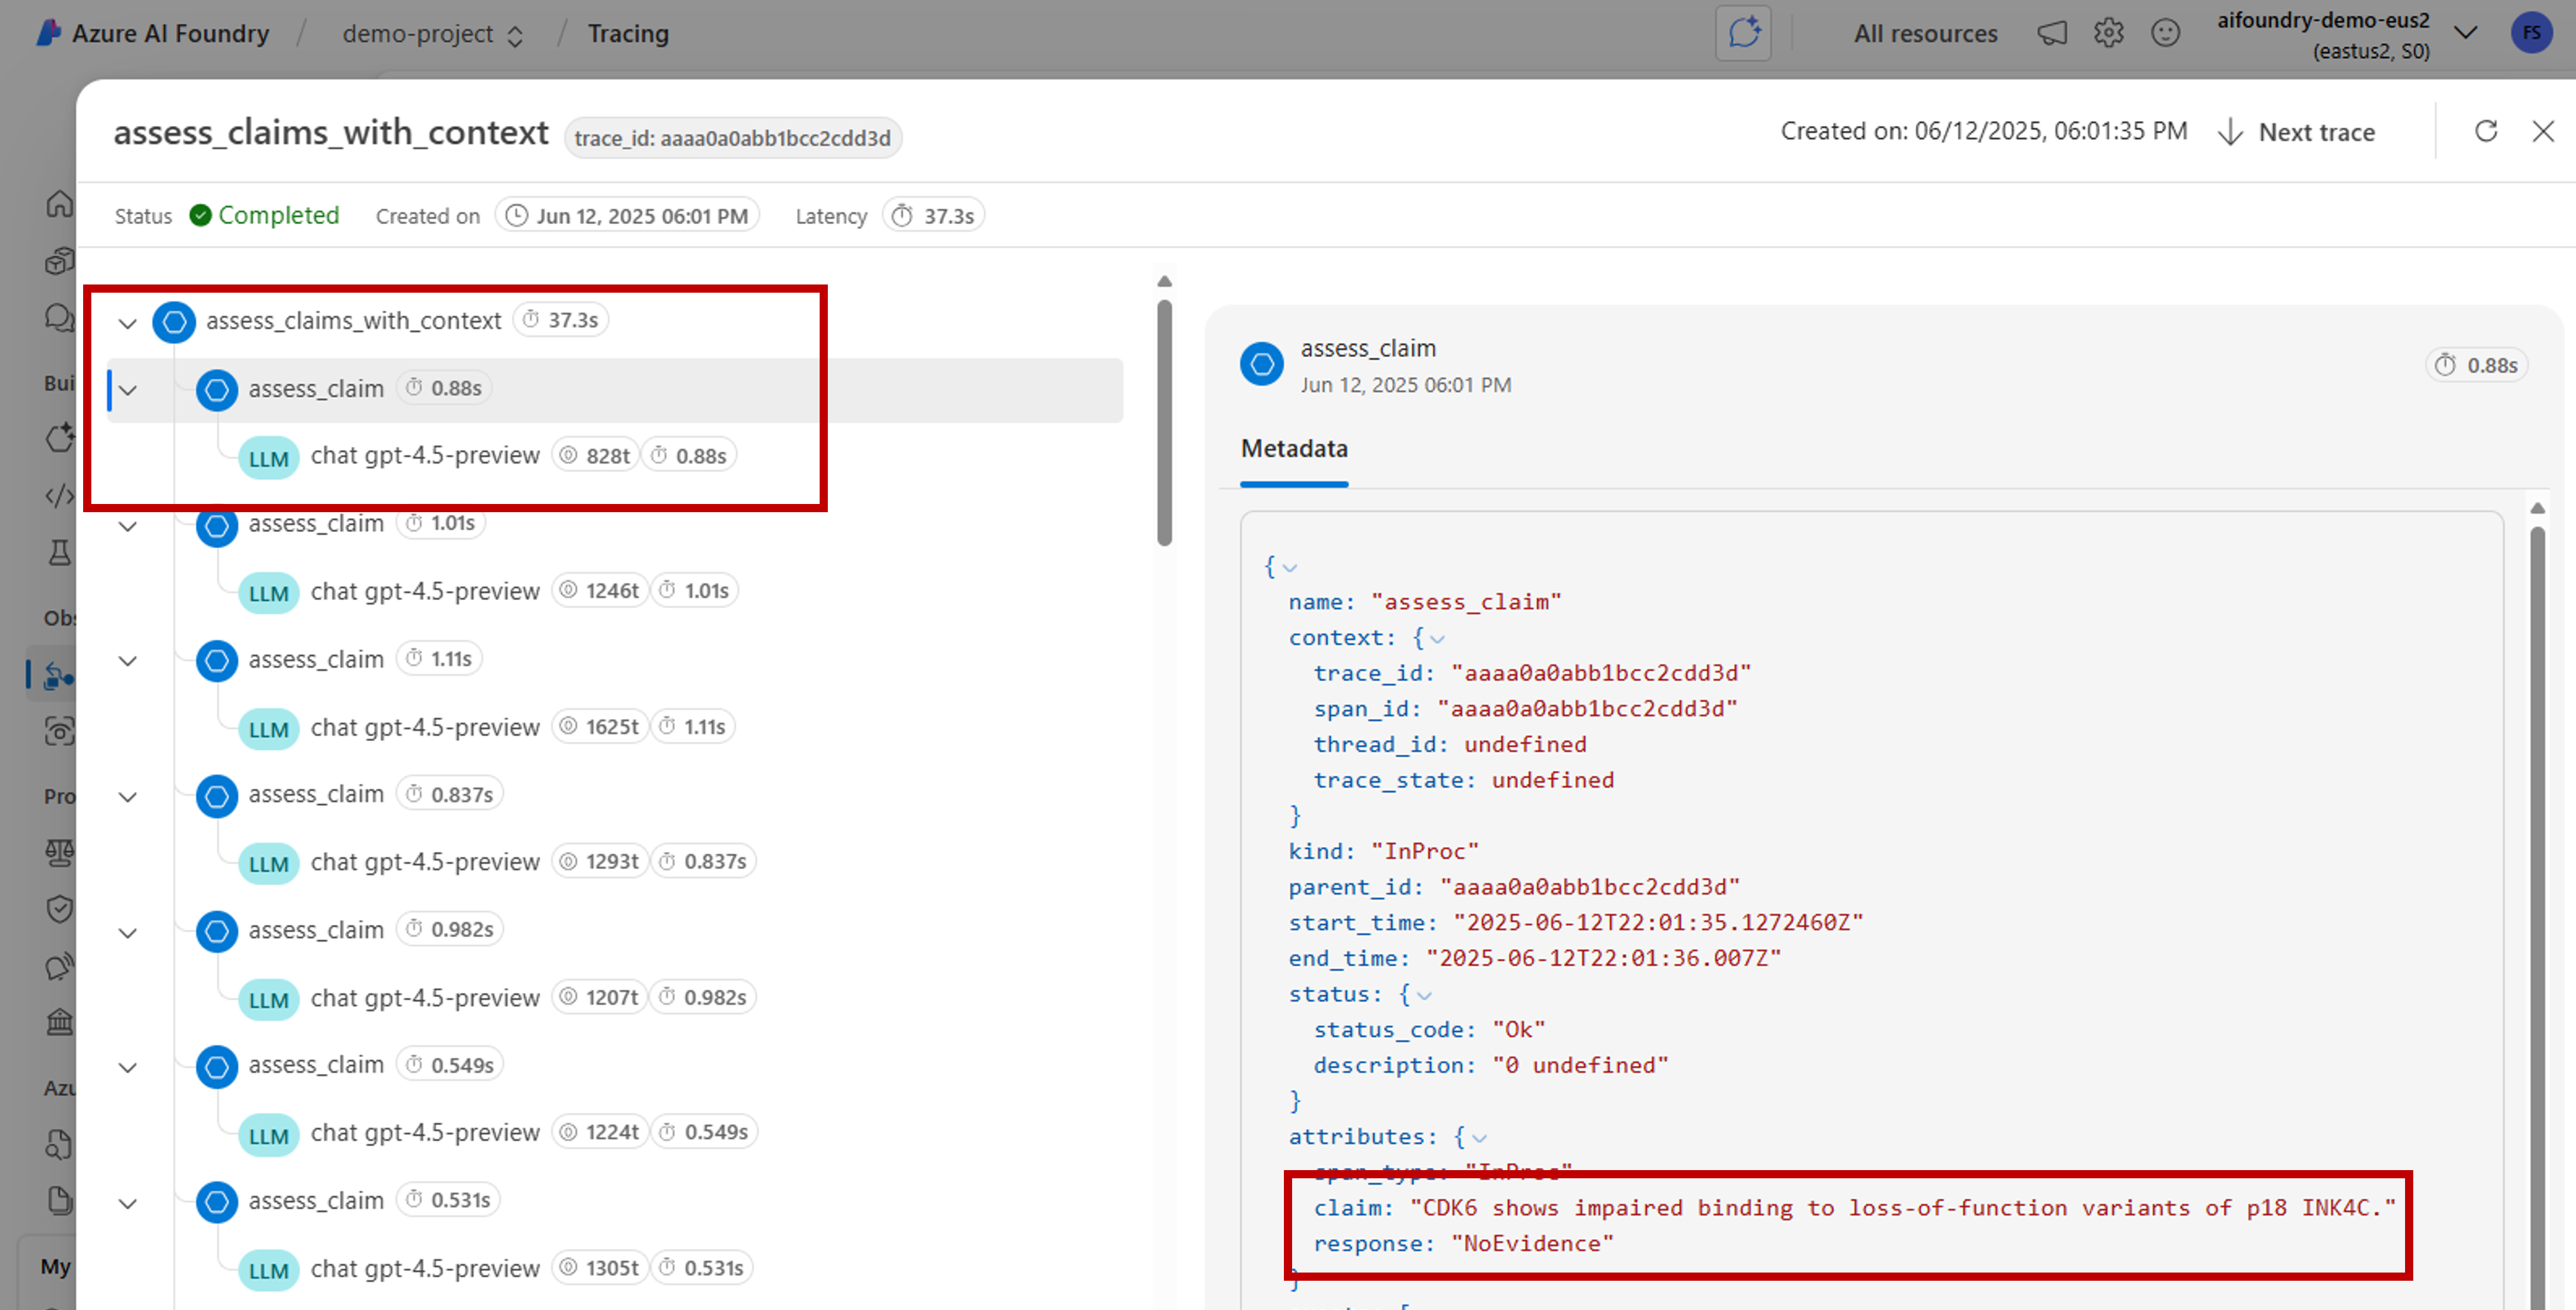
from opentelemetry import trace

tracer = trace.get_tracer(__name__)
Then, use decorators in your method to capture specific scenarios in your code that you're interested in. These decorators generate spans automatically. The following code example instruments a method called
assess_claims_with_contextthat iterates over a list of claims and verifies if the claim is supported by the context using an LLM. All the calls made in this method are captured within the same span:def build_prompt_with_context(claim: str, context: str) -> str: return [{'role': 'system', 'content': "I will ask you to assess whether a particular scientific claim, based on evidence provided. Output only the text 'True' if the claim is true, 'False' if the claim is false, or 'NEE' if there's not enough evidence."}, {'role': 'user', 'content': f""" The evidence is the following: {context} Assess the following claim on the basis of the evidence. Output only the text 'True' if the claim is true, 'False' if the claim is false, or 'NEE' if there's not enough evidence. Do not output any other text. Claim: {claim} Assessment: """}] @tracer.start_as_current_span("assess_claims_with_context") def assess_claims_with_context(claims, contexts): responses = [] for claim, context in zip(claims, contexts): response = client.chat.completions.create( model="gpt-4.1", messages=build_prompt_with_context(claim=claim, context=context), ) responses.append(response.choices[0].message.content.strip('., ')) return responsesTrace results look as follows:
You might also want to add extra information to the current span. OpenTelemetry uses the concept of attributes for that. Use the
traceobject to access them and include extra information. See how theassess_claims_with_contextmethod has been modified to include an attribute:@tracer.start_as_current_span("assess_claims_with_context") def assess_claims_with_context(claims, contexts): responses = [] current_span = trace.get_current_span() current_span.set_attribute("operation.claims_count", len(claims)) for claim, context in zip(claims, contexts): response = client.chat.completions.create( model="gpt-4.1", messages=build_prompt_with_context(claim=claim, context=context), ) responses.append(response.choices[0].message.content.strip('., ')) return responses


Trace to console
It might be useful to also trace your application and send the traces to the local execution console. This approach might be beneficial when running unit tests or integration tests in your application using an automated CI/CD pipeline. Traces can be sent to the console and captured by your CI/CD tool for further analysis.
Configure tracing as follows:
Instrument the OpenAI SDK as usual:
from opentelemetry.instrumentation.openai_v2 import OpenAIInstrumentor

OpenAIInstrumentor().instrument()
Configure OpenTelemetry to send traces to the console:
from opentelemetry import trace
from opentelemetry.sdk.trace import TracerProvider
from opentelemetry.sdk.trace.export import SimpleSpanProcessor, ConsoleSpanExporter

span_exporter = ConsoleSpanExporter()
tracer_provider = TracerProvider()
tracer_provider.add_span_processor(SimpleSpanProcessor(span_exporter))
trace.set_tracer_provider(tracer_provider)
Use OpenAI SDK as usual:
response = client.chat.completions.create(
    model="deepseek-v3-0324",
    messages=[
        {"role": "user", "content": "Write a short poem on open telemetry."},
    ],
)
{ "name": "chat deepseek-v3-0324", "context": { "trace_id": "0xaaaa0a0abb1bcc2cdd3d", "span_id": "0xaaaa0a0abb1bcc2cdd3d", "trace_state": "[]" }, "kind": "SpanKind.CLIENT", "parent_id": null, "start_time": "2025-06-13T00:02:04.271337Z", "end_time": "2025-06-13T00:02:06.537220Z", "status": { "status_code": "UNSET" }, "attributes": { "gen_ai.operation.name": "chat", "gen_ai.system": "openai", "gen_ai.request.model": "deepseek-v3-0324", "server.address": "my-project.services.ai.azure.com", "gen_ai.response.model": "DeepSeek-V3-0324", "gen_ai.response.finish_reasons": [ "stop" ], "gen_ai.response.id": "aaaa0a0abb1bcc2cdd3d", "gen_ai.usage.input_tokens": 14, "gen_ai.usage.output_tokens": 91 }, "events": [], "links": [], "resource": { "attributes": { "telemetry.sdk.language": "python", "telemetry.sdk.name": "opentelemetry", "telemetry.sdk.version": "1.31.1", "service.name": "unknown_service" }, "schema_url": "" } }
Trace locally with AI Toolkit
AI Toolkit offers a simple way to trace locally in VS Code. It uses a local OTLP-compatible collector, making it perfect for development and debugging without needing cloud access.
The toolkit supports the OpenAI SDK and other AI frameworks through OpenTelemetry. You can see traces instantly in your development environment.
For detailed setup instructions and SDK-specific code examples, see Tracing in AI Toolkit.